| Red | Green | Blue | |
| z | 17.64 | ||
| znorm | Inf | ||
| sky | -Inf | -NaN | -Inf |
| S/N | 26.2 | 46.2 | 49.7 |
| S/N(c) | 0.0 | 0.0 | 0.0 |
| SN(E/C) |
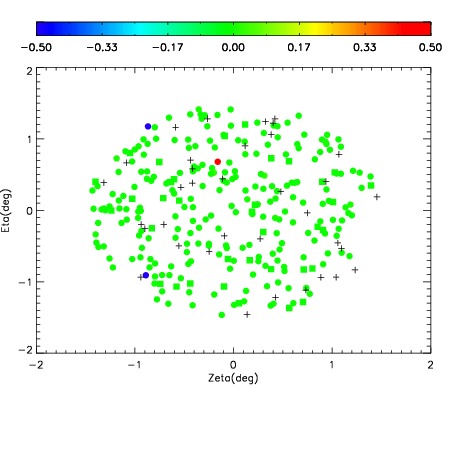
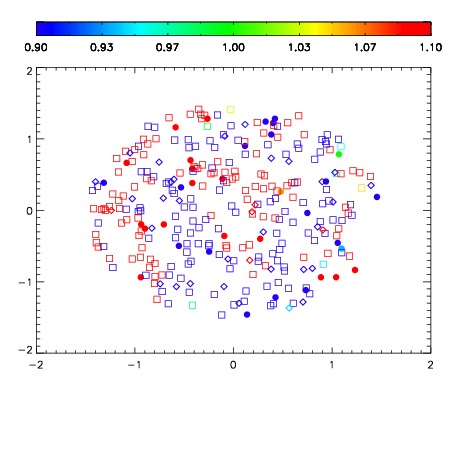
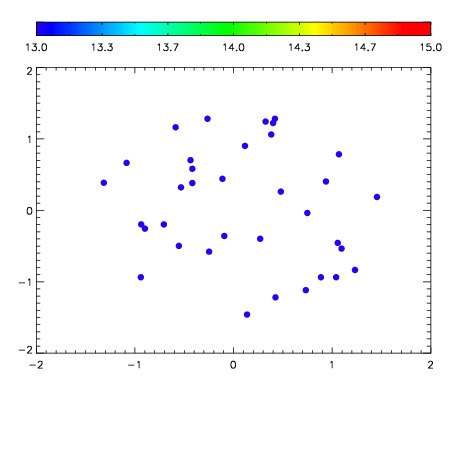

| Frame | Nreads | Zeropoints | Mag plots | Spatial mag deviation | Spatial sky 16325A emission deviations (filled: sky, open: star) | Spatial sky continuum emission | Spatial sky telluric CO2 absorption deviations (filled: H < 10) | |||||||||||||||||||||||
| 0 | 0 |
|
|
|
|
|
|
| IPAIR | NAME | SHIFT | NEWSHIFT | S/N | NAME | SHIFT | NEWSHIFT | S/N |
| 0 | 10820020 | 0.485469 | 0.00000 | 244.279 | 10820011 | 0.00000 | 0.485469 | 236.272 |
| 1 | 10820012 | 0.482248 | 0.00322101 | 230.939 | 10820018 | -0.000292941 | 0.485762 | 228.804 |
| 2 | 10820017 | 0.484819 | 0.000650018 | 216.194 | 10820019 | -1.80737e-05 | 0.485487 | 226.480 |
| 3 | 10820013 | 0.482663 | 0.00280601 | 198.575 | 10820014 | -0.00162684 | 0.487096 | 205.393 |
| 4 | 10820016 | 0.484707 | 0.000762016 | 187.052 | 10820015 | -0.00173657 | 0.487206 | 201.860 |