| Red | Green | Blue | |
| z | 17.64 | ||
| znorm | Inf | ||
| sky | -Inf | -Inf | -Inf |
| S/N | 26.7 | 44.3 | 50.3 |
| S/N(c) | 0.0 | 0.0 | 0.0 |
| SN(E/C) |
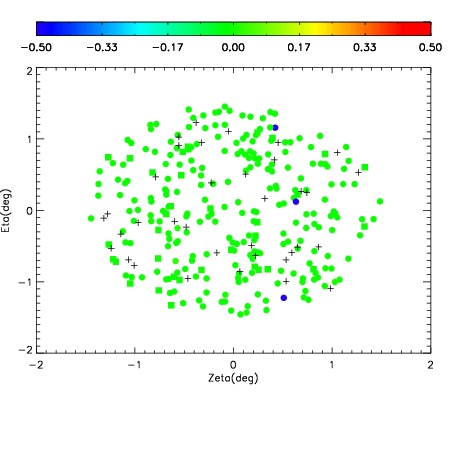
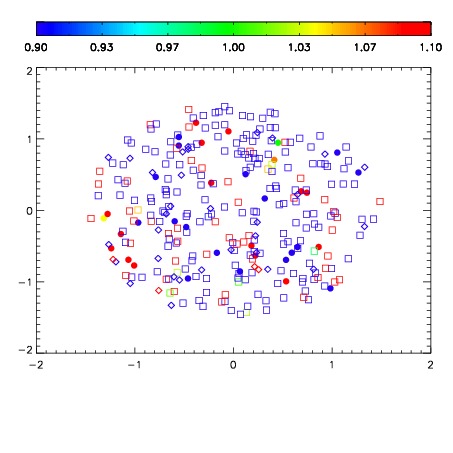
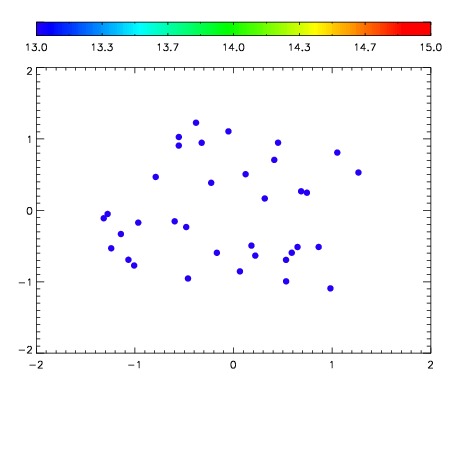

| Frame | Nreads | Zeropoints | Mag plots | Spatial mag deviation | Spatial sky 16325A emission deviations (filled: sky, open: star) | Spatial sky continuum emission | Spatial sky telluric CO2 absorption deviations (filled: H < 10) | |||||||||||||||||||||||
| 0 | 0 |
|
|
|
|
|
|
| IPAIR | NAME | SHIFT | NEWSHIFT | S/N | NAME | SHIFT | NEWSHIFT | S/N |
| 0 | 10200054 | 0.490429 | 0.00000 | 206.202 | 10200052 | 0.00176287 | 0.488666 | 208.111 |
| 1 | 10200050 | 0.490123 | 0.000306010 | 208.971 | 10200055 | -0.00195337 | 0.492382 | 214.130 |
| 2 | 10200049 | 0.489818 | 0.000611007 | 207.334 | 10200051 | 0.00179411 | 0.488635 | 210.264 |
| 3 | 10200053 | 0.490404 | 2.50041e-05 | 201.251 | 10200048 | 0.00000 | 0.490429 | 197.720 |