| Red | Green | Blue | |
| z | 17.64 | ||
| znorm | Inf | ||
| sky | -Inf | -Inf | -Inf |
| S/N | 27.0 | 46.1 | 50.5 |
| S/N(c) | 0.0 | 0.0 | 0.0 |
| SN(E/C) |
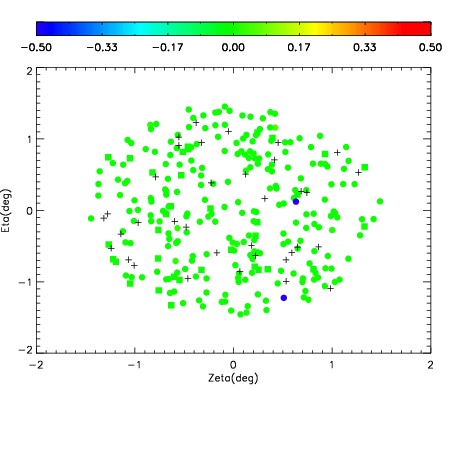
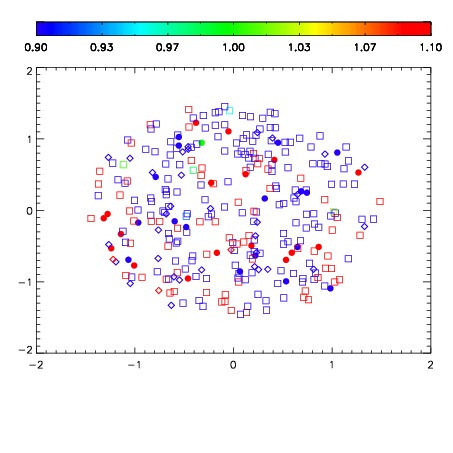
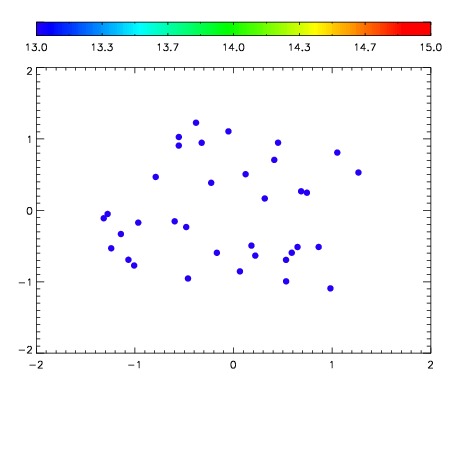

| Frame | Nreads | Zeropoints | Mag plots | Spatial mag deviation | Spatial sky 16325A emission deviations (filled: sky, open: star) | Spatial sky continuum emission | Spatial sky telluric CO2 absorption deviations (filled: H < 10) | |||||||||||||||||||||||
| 0 | 0 |
|
|
|
|
|
|
| IPAIR | NAME | SHIFT | NEWSHIFT | S/N | NAME | SHIFT | NEWSHIFT | S/N |
| 0 | 10460039 | 0.500672 | 0.00000 | 222.124 | 10460041 | 0.00192170 | 0.498750 | 220.420 |
| 1 | 10460042 | 0.498908 | 0.00176397 | 223.050 | 10460037 | 0.00000 | 0.500672 | 220.601 |
| 2 | 10460038 | 0.500310 | 0.000361979 | 220.905 | 10460040 | 0.00238907 | 0.498283 | 218.301 |
| 3 | 10460043 | 0.499840 | 0.000831991 | 220.345 | 10460044 | 0.00341159 | 0.497260 | 213.006 |