| Red | Green | Blue | |
| z | 17.64 | ||
| znorm | Inf | ||
| sky | -Inf | -Inf | -Inf |
| S/N | 27.1 | 46.8 | 51.1 |
| S/N(c) | 0.0 | 0.0 | 0.0 |
| SN(E/C) |
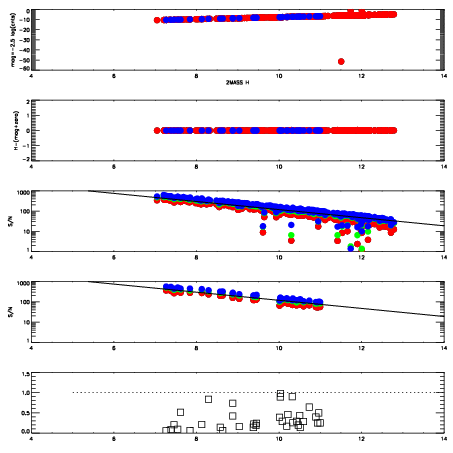
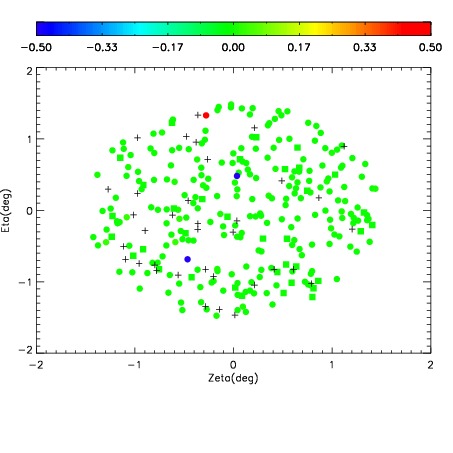
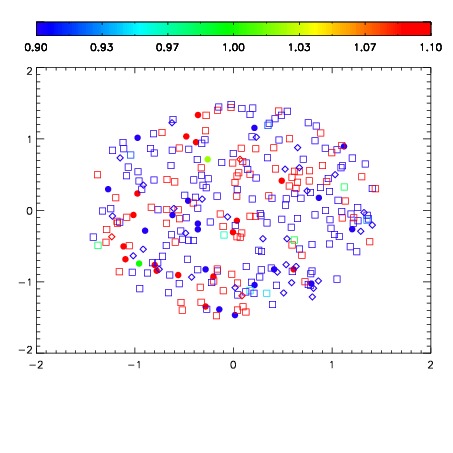
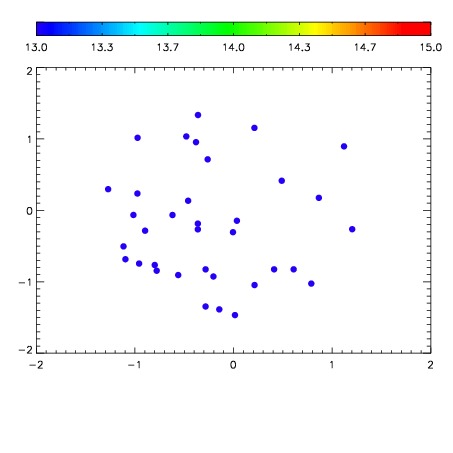

| Frame | Nreads | Zeropoints | Mag plots | Spatial mag deviation | Spatial sky 16325A emission deviations (filled: sky, open: star) | Spatial sky continuum emission | Spatial sky telluric CO2 absorption deviations (filled: H < 10) | |||||||||||||||||||||||
| 0 | 0 |
|
|
|
|
|
|
| IPAIR | NAME | SHIFT | NEWSHIFT | S/N | NAME | SHIFT | NEWSHIFT | S/N |
| 0 | 10460054 | 0.498278 | 0.00000 | 225.399 | 10460052 | 0.00260566 | 0.495672 | 227.893 |
| 1 | 10460053 | 0.497778 | 0.000499994 | 226.701 | 10460055 | -0.00132706 | 0.499605 | 229.231 |
| 2 | 10460050 | 0.498142 | 0.000135988 | 225.083 | 10460051 | 0.00295920 | 0.495319 | 224.992 |
| 3 | 10460049 | 0.497977 | 0.000301003 | 224.289 | 10460048 | 0.00000 | 0.498278 | 223.778 |