| Red | Green | Blue | |
| z | 17.64 | ||
| znorm | Inf | ||
| sky | -Inf | -Inf | -Inf |
| S/N | 23.8 | 41.5 | 46.0 |
| S/N(c) | 0.0 | 0.0 | 0.0 |
| SN(E/C) |
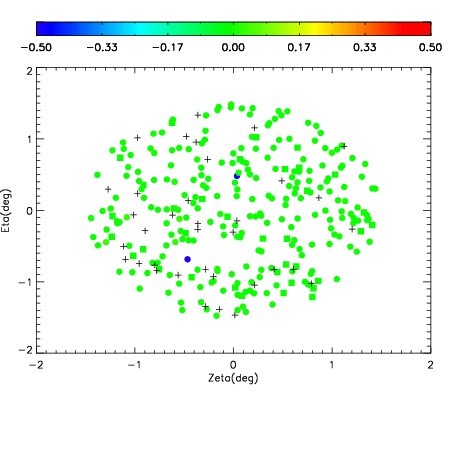
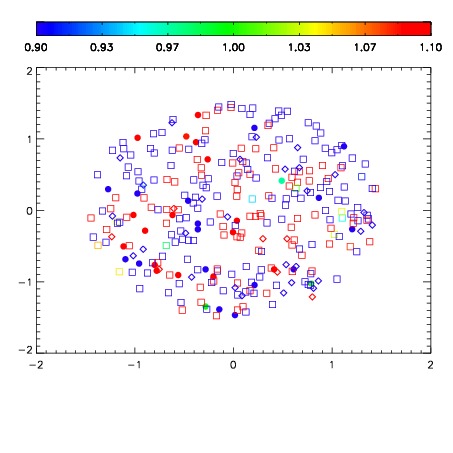
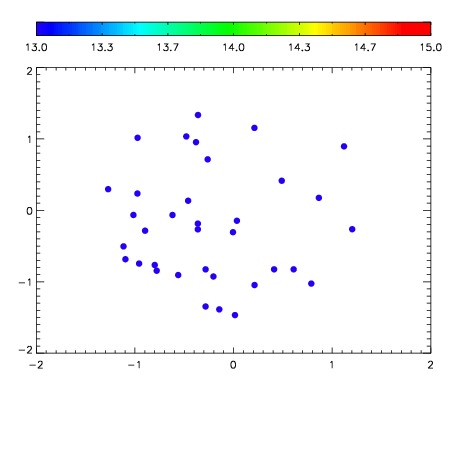

| Frame | Nreads | Zeropoints | Mag plots | Spatial mag deviation | Spatial sky 16325A emission deviations (filled: sky, open: star) | Spatial sky continuum emission | Spatial sky telluric CO2 absorption deviations (filled: H < 10) | |||||||||||||||||||||||
| 0 | 0 |
|
|
|
|
|
|
| IPAIR | NAME | SHIFT | NEWSHIFT | S/N | NAME | SHIFT | NEWSHIFT | S/N |
| 0 | 10800032 | 0.490189 | 0.00000 | 238.949 | 10800033 | -0.000677663 | 0.490867 | 232.909 |
| 1 | 10800031 | 0.489753 | 0.000435978 | 233.222 | 10800030 | 0.000369326 | 0.489820 | 228.782 |
| 2 | 10800027 | 0.489372 | 0.000817001 | 215.350 | 10800026 | 0.00000 | 0.490189 | 223.461 |
| 3 | 10800028 | 0.489268 | 0.000920981 | 208.681 | 10800029 | -0.000678918 | 0.490868 | 213.462 |