| Red | Green | Blue | |
| z | 17.64 | ||
| znorm | Inf | ||
| sky | -Inf | -NaN | -Inf |
| S/N | 24.0 | 41.8 | 46.8 |
| S/N(c) | 0.0 | 0.0 | 0.0 |
| SN(E/C) |
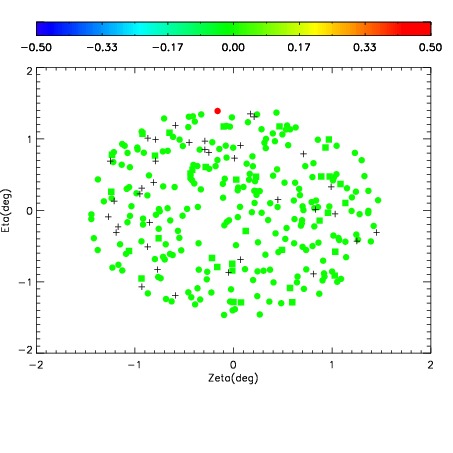
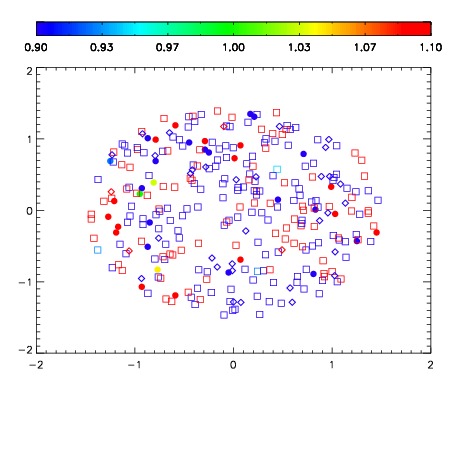
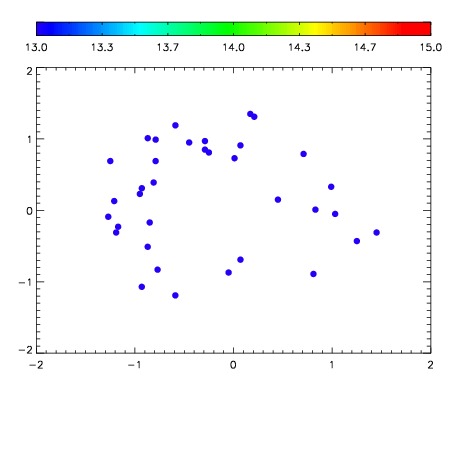

| Frame | Nreads | Zeropoints | Mag plots | Spatial mag deviation | Spatial sky 16325A emission deviations (filled: sky, open: star) | Spatial sky continuum emission | Spatial sky telluric CO2 absorption deviations (filled: H < 10) | |||||||||||||||||||||||
| 0 | 0 |
|
|
|
|
|
|
| IPAIR | NAME | SHIFT | NEWSHIFT | S/N | NAME | SHIFT | NEWSHIFT | S/N |
| 0 | 10490056 | 0.496929 | 0.00000 | 185.556 | 10490053 | 0.00184589 | 0.495083 | 190.611 |
| 1 | 10490055 | 0.496705 | 0.000223994 | 191.302 | 10490054 | 0.00166752 | 0.495261 | 199.362 |
| 2 | 10490051 | 0.496399 | 0.000530005 | 188.670 | 10490057 | -0.000284365 | 0.497213 | 192.756 |
| 3 | 10490052 | 0.496663 | 0.000265986 | 184.491 | 10490050 | 0.00000 | 0.496929 | 180.269 |