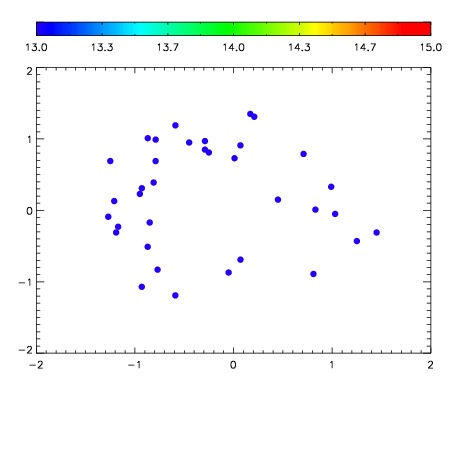
| Frame | Nreads | Zeropoints | Mag plots
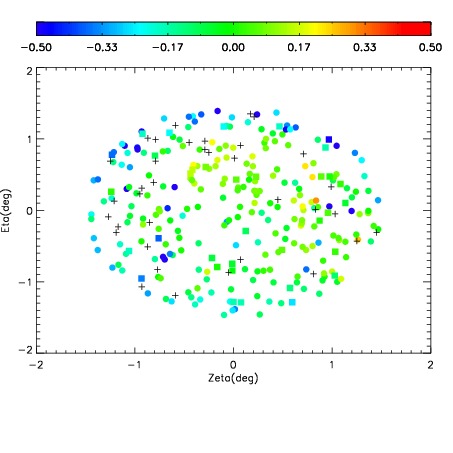
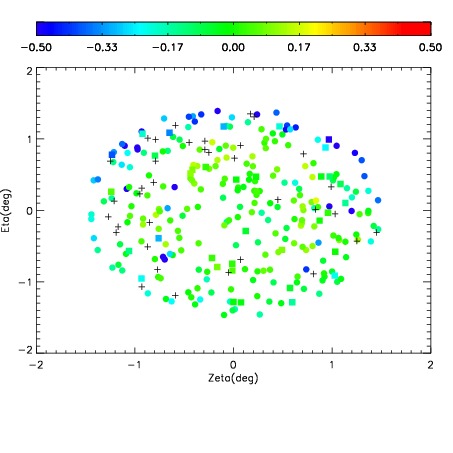
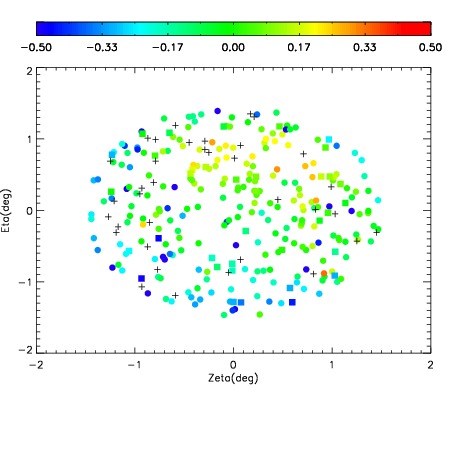
| Spatial mag deviation
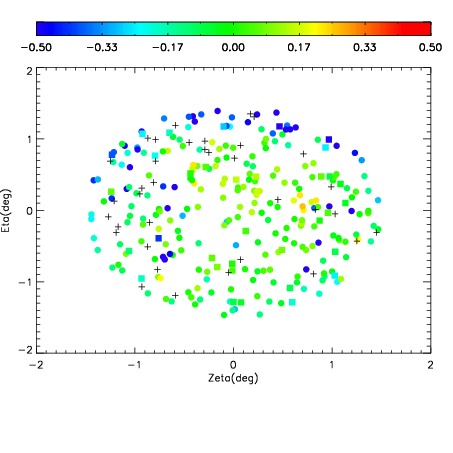
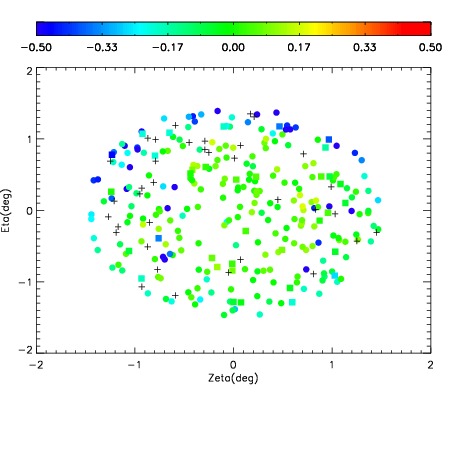
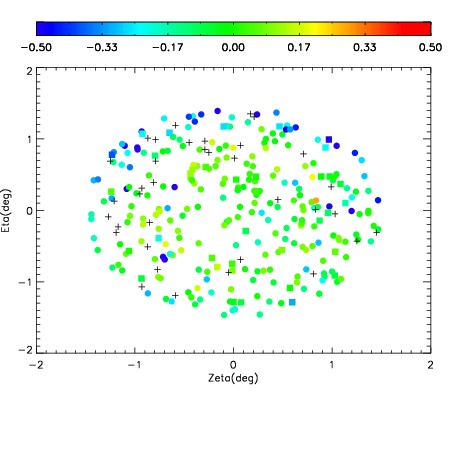
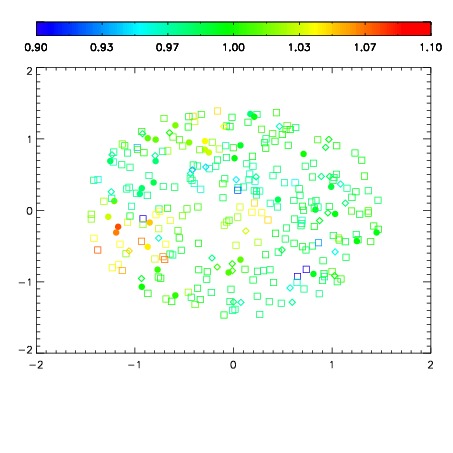
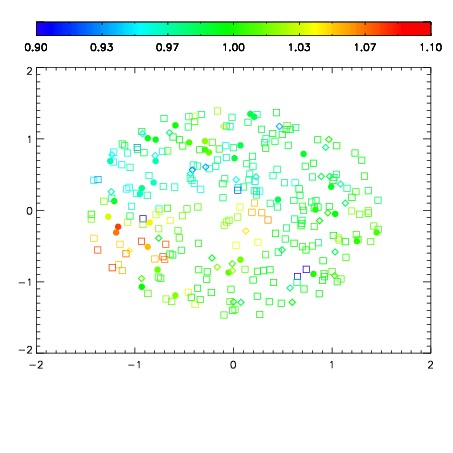
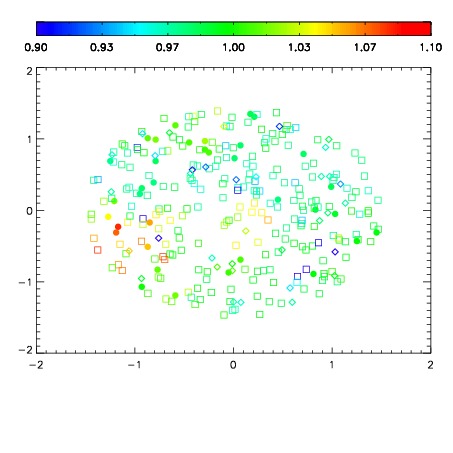
| Spatial sky 16325A emission deviations (filled: sky, open: star)
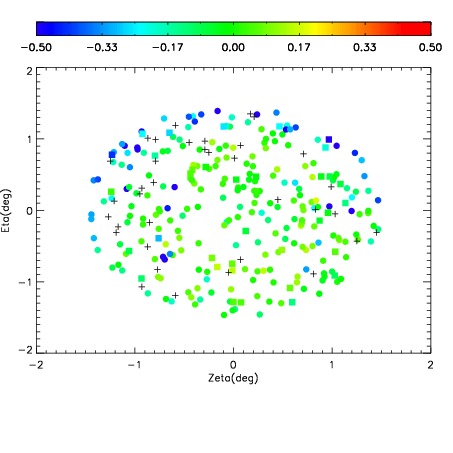
| Spatial sky continuum emission
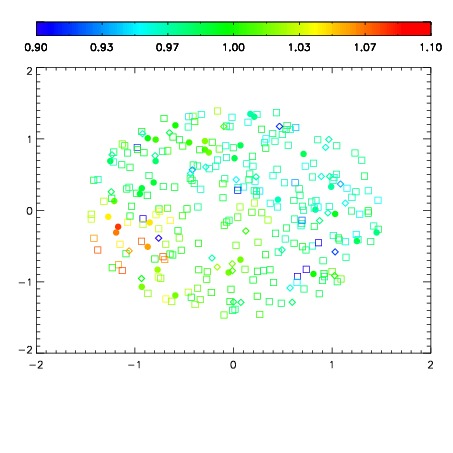
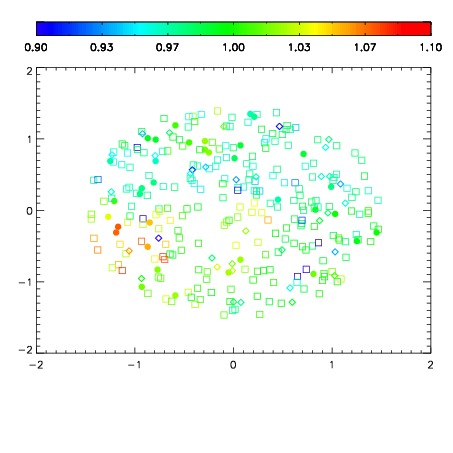
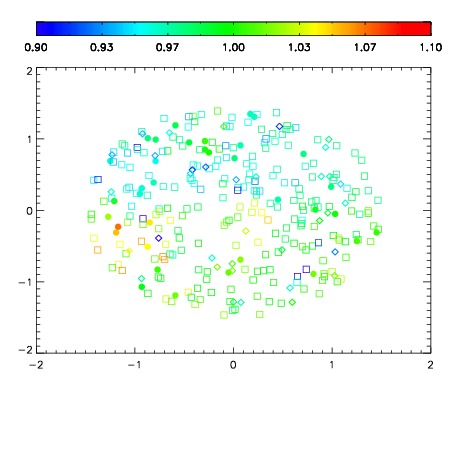
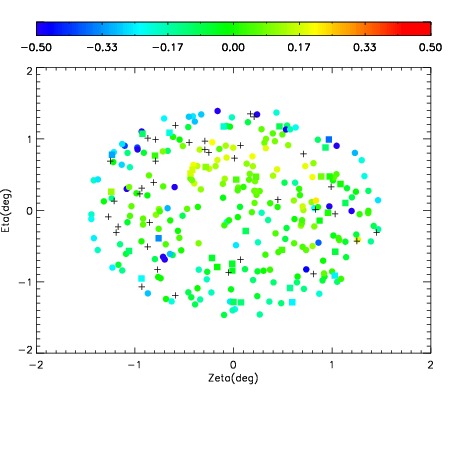
| Spatial sky telluric CO2 absorption deviations (filled: H < 10)
|
| 10540048
| 47
| | Red | Green | Blue
| | z | | 17.09
| | znorm | | 12.91
| | sky | 13.1 | 12.9 | 13.0
| | S/N | 2.7 | 4.7 | 5.8
| | S/N(c) | 2.3 | 4.2 | 5.7
| | SN(E/C) 0.78
|
| 
| 
| 
| 
| 
|
| 10540049
| 47
| | Red | Green | Blue
| | z | | 17.47
| | znorm | | 13.29
| | sky | 13.2 | 13.1 | 13.2
| | S/N | 3.8 | 6.9 | 7.8
| | S/N(c) | 3.4 | 6.3 | 7.4
| | SN(E/C) 0.67
|
| 
| 
| 
| 
| 
|
| 10540050
| 47
| | Red | Green | Blue
| | z | | 17.33
| | znorm | | 13.15
| | sky | 13.1 | 13.0 | 13.1
| | S/N | 3.5 | 6.5 | 6.7
| | S/N(c) | 3.1 | 5.9 | 6.5
| | SN(E/C) 0.68
|
| 
| 
| 
| 
| 
|
| 10540051
| 47
| | Red | Green | Blue
| | z | | 16.83
| | znorm | | 12.65
| | sky | 12.9 | 12.8 | 12.9
| | S/N | 2.2 | 4.2 | 4.8
| | S/N(c) | 1.9 | 3.8 | 4.2
| | SN(E/C) 0.85
|
| 
| 
| 
| 
| 
|
| 10540052
| 47
| | Red | Green | Blue
| | z | | 17.56
| | znorm | | 13.38
| | sky | 13.1 | 13.0 | 13.1
| | S/N | 4.0 | 7.7 | 8.2
| | S/N(c) | 3.6 | 7.0 | 7.6
| | SN(E/C) 0.63
|
| 
| 
| 
| 
| 
|
| 10540053
| 47
| | Red | Green | Blue
| | z | | 17.69
| | znorm | | 13.51
| | sky | 13.3 | 13.2 | 13.4
| | S/N | 4.9 | 9.3 | 10.2
| | S/N(c) | 4.4 | 8.5 | 9.4
| | SN(E/C) 0.63
|
| 
| 
| 
| 
| 
|
| 10540054
| 47
| | Red | Green | Blue
| | z | | 16.57
| | znorm | | 12.39
| | sky | 13.0 | 12.9 | 13.0
| | S/N | 1.9 | 3.5 | 3.8
| | S/N(c) | 1.6 | 3.3 | 3.5
| | SN(E/C) 0.83
|
| 
| 
| 
| 
| 
|
| 10540055
| 47
| | Red | Green | Blue
| | z | | 17.24
| | znorm | | 13.06
| | sky | 13.1 | 13.0 | 13.1
| | S/N | 3.3 | 6.3 | 7.0
| | S/N(c) | 3.0 | 5.3 | 6.6
| | SN(E/C) 0.70
|
| 
| 
| 
| 
| 
|