| Red | Green | Blue | |
| z | 17.64 | ||
| znorm | Inf | ||
| sky | -Inf | -Inf | -Inf |
| S/N | 6.1 | 11.6 | 12.9 |
| S/N(c) | 0.0 | 0.0 | 0.0 |
| SN(E/C) |
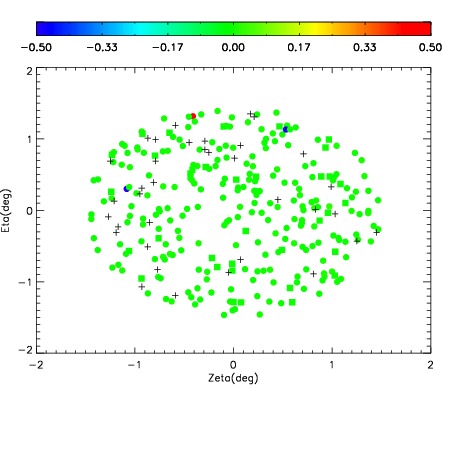
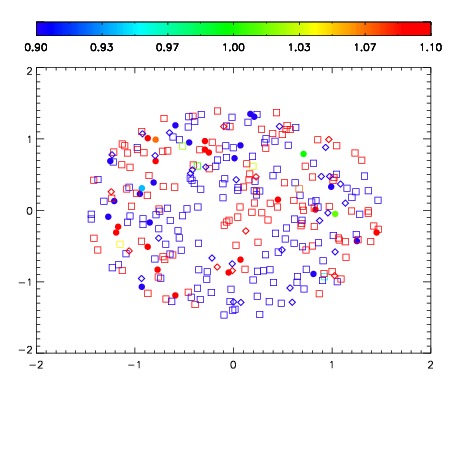
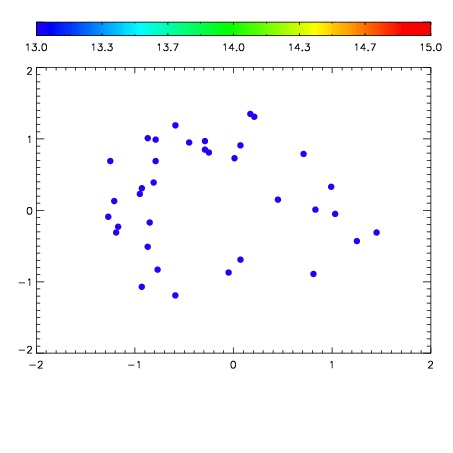

| Frame | Nreads | Zeropoints | Mag plots | Spatial mag deviation | Spatial sky 16325A emission deviations (filled: sky, open: star) | Spatial sky continuum emission | Spatial sky telluric CO2 absorption deviations (filled: H < 10) | |||||||||||||||||||||||
| 0 | 0 |
|
|
|
|
|
|
| IPAIR | NAME | SHIFT | NEWSHIFT | S/N | NAME | SHIFT | NEWSHIFT | S/N |
| 0 | 10540049 | 0.501211 | 0.00000 | 90.8146 | 10540055 | 0.00304948 | 0.498161 | 92.7191 |
| 1 | 10540053 | 0.499782 | 0.00142899 | 109.613 | 10540052 | 0.00724352 | 0.493967 | 100.369 |
| 2 | 10540050 | 0.500967 | 0.000243962 | 88.5617 | 10540051 | 0.00749960 | 0.493711 | 71.4487 |
| 3 | 10540054 | 0.500559 | 0.000652015 | 71.1134 | 10540048 | 0.00000 | 0.501211 | 68.7888 |