| Red | Green | Blue | |
| z | 17.64 | ||
| znorm | Inf | ||
| sky | -Inf | -Inf | -Inf |
| S/N | 24.9 | 40.8 | 48.4 |
| S/N(c) | 0.0 | 0.0 | 0.0 |
| SN(E/C) |
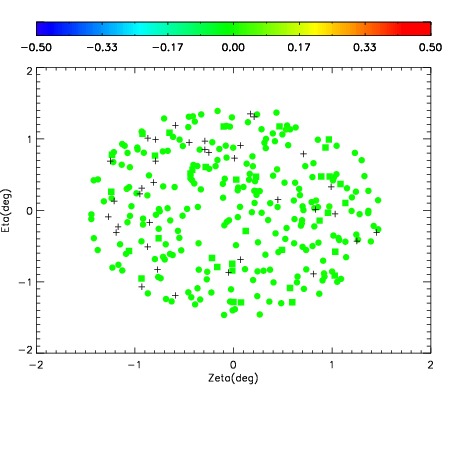
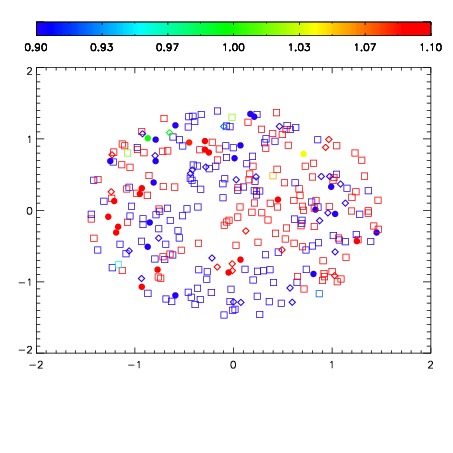
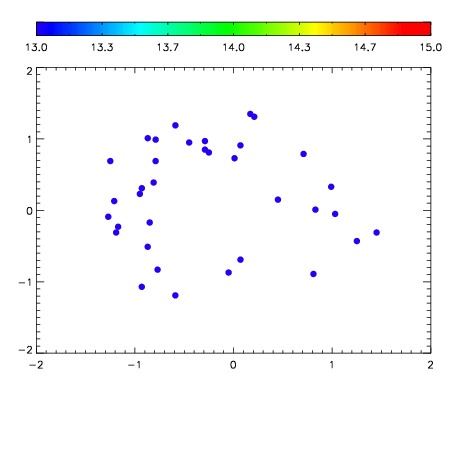

| Frame | Nreads | Zeropoints | Mag plots | Spatial mag deviation | Spatial sky 16325A emission deviations (filled: sky, open: star) | Spatial sky continuum emission | Spatial sky telluric CO2 absorption deviations (filled: H < 10) | |||||||||||||||||||||||
| 0 | 0 |
|
|
|
|
|
|
| IPAIR | NAME | SHIFT | NEWSHIFT | S/N | NAME | SHIFT | NEWSHIFT | S/N |
| 0 | 10790042 | 0.495864 | 0.00000 | 200.093 | 10790043 | -0.00192571 | 0.497790 | 193.864 |
| 1 | 10790038 | 0.495353 | 0.000510991 | 196.058 | 10790036 | 0.00000 | 0.495864 | 188.855 |
| 2 | 10790037 | 0.495056 | 0.000808001 | 193.945 | 10790039 | -0.00143641 | 0.497300 | 185.942 |
| 3 | 10790041 | 0.495498 | 0.000366002 | 185.226 | 10790040 | -0.00142882 | 0.497293 | 183.551 |