| Red | Green | Blue | |
| z | 17.64 | ||
| znorm | Inf | ||
| sky | -Inf | -Inf | -Inf |
| S/N | 27.2 | 45.7 | 49.5 |
| S/N(c) | 0.0 | 0.0 | 0.0 |
| SN(E/C) |
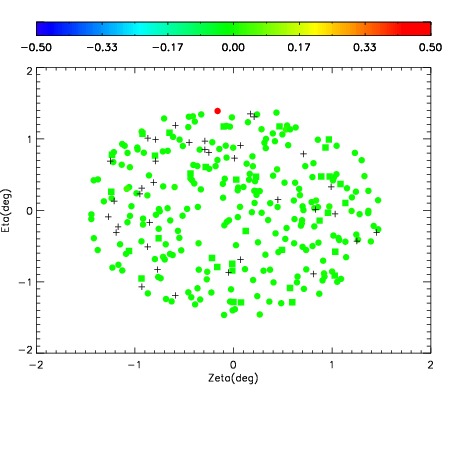
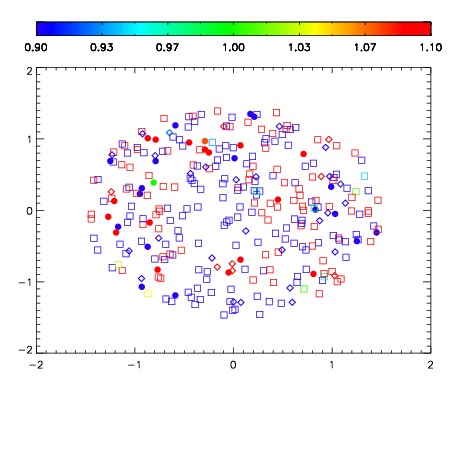


| Frame | Nreads | Zeropoints | Mag plots | Spatial mag deviation | Spatial sky 16325A emission deviations (filled: sky, open: star) | Spatial sky continuum emission | Spatial sky telluric CO2 absorption deviations (filled: H < 10) | |||||||||||||||||||||||
| 0 | 0 |
|
|
|
|
|
|
| IPAIR | NAME | SHIFT | NEWSHIFT | S/N | NAME | SHIFT | NEWSHIFT | S/N |
| 0 | 10890032 | 0.506986 | 0.00000 | 212.695 | 10890033 | -0.00305442 | 0.510040 | 215.372 |
| 1 | 10890031 | 0.505405 | 0.00158101 | 207.099 | 10890029 | -0.00119345 | 0.508179 | 206.748 |
| 2 | 10890028 | 0.504479 | 0.00250703 | 204.708 | 10890030 | -0.000784852 | 0.507771 | 203.712 |
| 3 | 10890027 | 0.503205 | 0.00378102 | 204.283 | 10890026 | 0.00000 | 0.506986 | 202.691 |