| Red | Green | Blue | |
| z | 17.64 | ||
| znorm | Inf | ||
| sky | -NaN | -Inf | -Inf |
| S/N | 23.8 | 43.9 | 47.1 |
| S/N(c) | 0.0 | 0.0 | 0.0 |
| SN(E/C) |
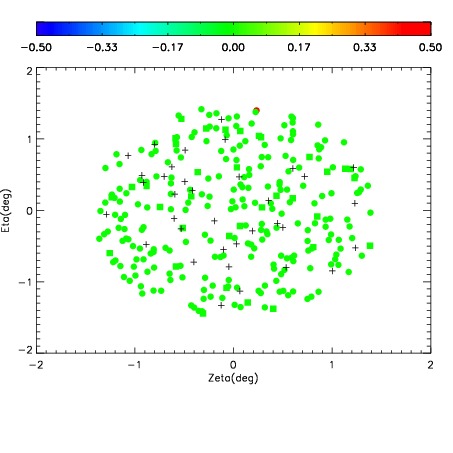
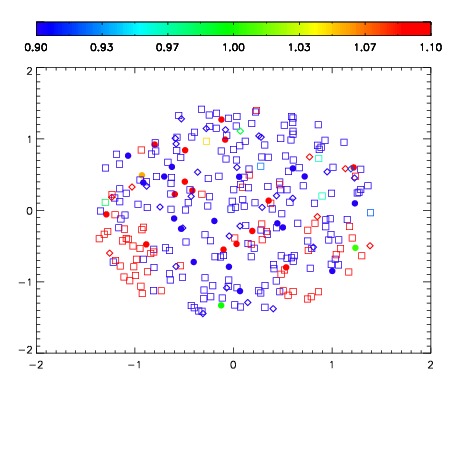
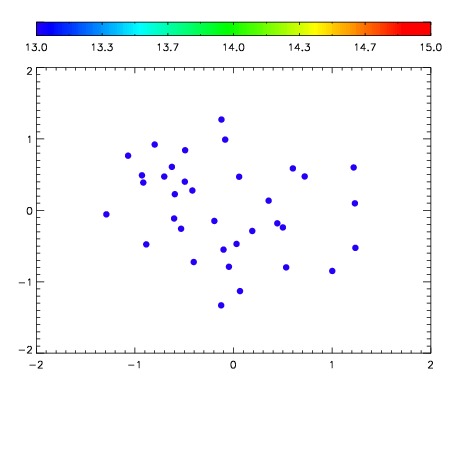

| Frame | Nreads | Zeropoints | Mag plots | Spatial mag deviation | Spatial sky 16325A emission deviations (filled: sky, open: star) | Spatial sky continuum emission | Spatial sky telluric CO2 absorption deviations (filled: H < 10) | |||||||||||||||||||||||
| 0 | 0 |
|
|
|
|
|
|
| IPAIR | NAME | SHIFT | NEWSHIFT | S/N | NAME | SHIFT | NEWSHIFT | S/N |
| 0 | 07870047 | 0.458517 | 0.00000 | 147.488 | 07870049 | -0.00354747 | 0.462064 | 154.856 |
| 1 | 07870044 | 0.458507 | 9.98378e-06 | 158.803 | 07870045 | -0.00264892 | 0.461166 | 157.192 |
| 2 | 07870043 | 0.458440 | 7.69794e-05 | 157.392 | 07870042 | 0.00000 | 0.458517 | 155.820 |
| 3 | 07870048 | 0.458409 | 0.000107974 | 154.568 | 07870046 | -0.00305353 | 0.461571 | 155.428 |