| Red | Green | Blue | |
| z | 17.64 | ||
| znorm | Inf | ||
| sky | -Inf | -Inf | -Inf |
| S/N | 26.0 | 48.3 | 51.9 |
| S/N(c) | 0.0 | 0.0 | 0.0 |
| SN(E/C) |
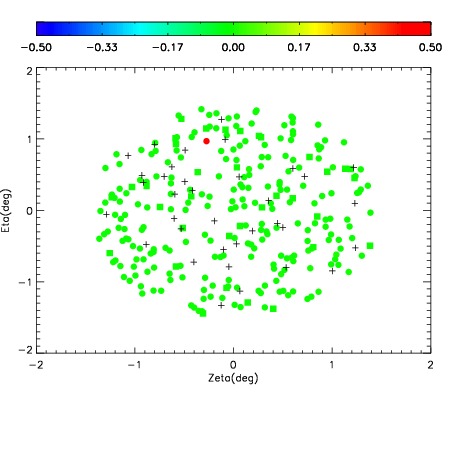
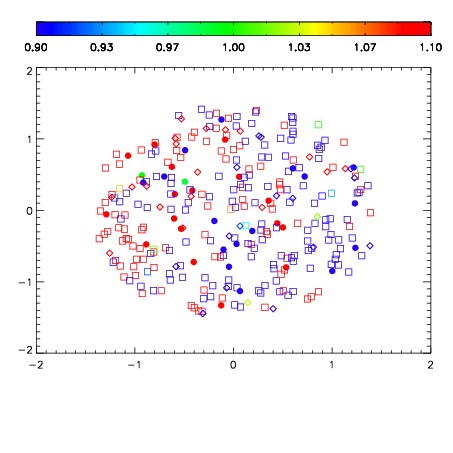
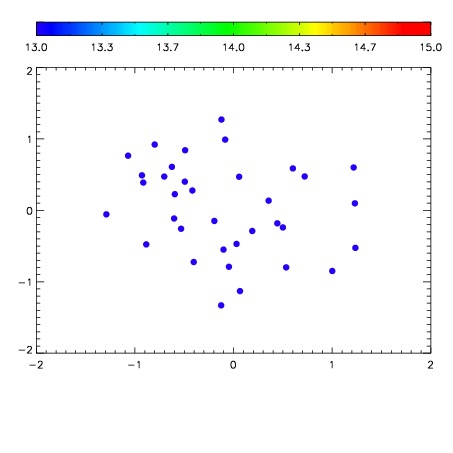

| Frame | Nreads | Zeropoints | Mag plots | Spatial mag deviation | Spatial sky 16325A emission deviations (filled: sky, open: star) | Spatial sky continuum emission | Spatial sky telluric CO2 absorption deviations (filled: H < 10) | |||||||||||||||||||||||
| 0 | 0 |
|
|
|
|
|
|
| IPAIR | NAME | SHIFT | NEWSHIFT | S/N | NAME | SHIFT | NEWSHIFT | S/N |
| 0 | 10780040 | 0.494938 | 0.00000 | 117.183 | 10780038 | 0.00251042 | 0.492428 | 119.694 |
| 1 | 10780027 | 0.491518 | 0.00342000 | 135.182 | 10780026 | 0.00000 | 0.494938 | 135.961 |
| 2 | 10780028 | 0.492904 | 0.00203398 | 128.299 | 10780033 | -0.000294734 | 0.495233 | 128.505 |
| 3 | 10780035 | 0.489915 | 0.00502297 | 128.209 | 10780030 | 0.000486477 | 0.494452 | 124.646 |
| 4 | 10780031 | 0.490462 | 0.00447598 | 127.348 | 10780037 | 0.00189820 | 0.493040 | 124.093 |
| 5 | 10780036 | 0.491101 | 0.00383699 | 127.284 | 10780029 | 0.000428257 | 0.494510 | 121.204 |
| 6 | 10780039 | 0.492763 | 0.00217497 | 126.425 | 10780041 | 0.00183663 | 0.493101 | 120.979 |
| 7 | 10780032 | 0.490576 | 0.00436199 | 124.219 | 10780034 | -0.000735319 | 0.495673 | 120.692 |