| Red | Green | Blue | |
| z | 17.64 | ||
| znorm | Inf | ||
| sky | -Inf | -Inf | -Inf |
| S/N | 21.5 | 37.5 | 42.0 |
| S/N(c) | 0.0 | 0.0 | 0.0 |
| SN(E/C) |
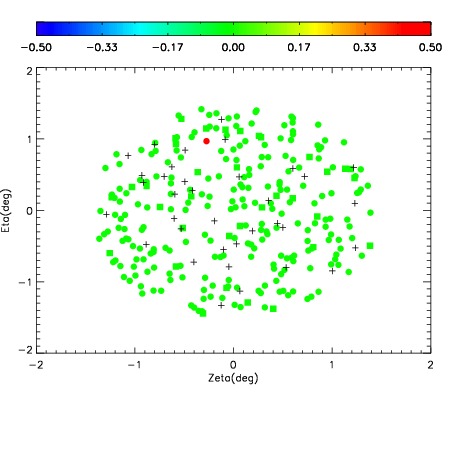
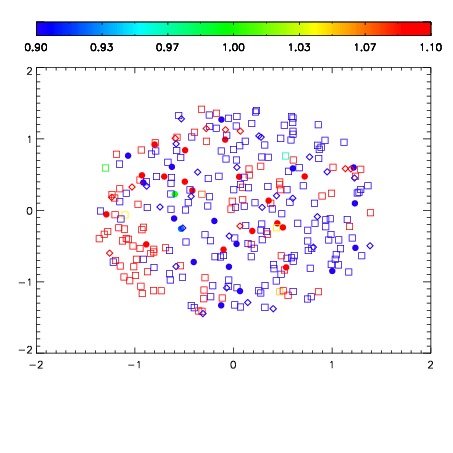
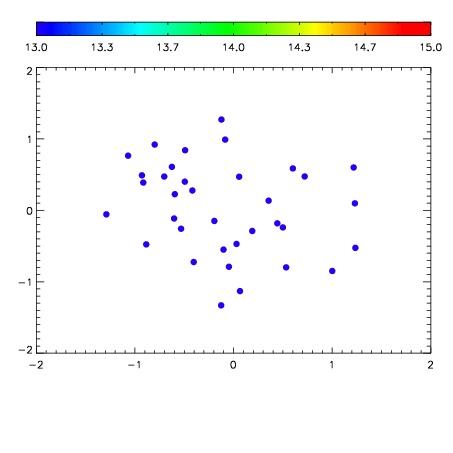

| Frame | Nreads | Zeropoints | Mag plots | Spatial mag deviation | Spatial sky 16325A emission deviations (filled: sky, open: star) | Spatial sky continuum emission | Spatial sky telluric CO2 absorption deviations (filled: H < 10) | |||||||||||||||||||||||
| 0 | 0 |
|
|
|
|
|
|
| IPAIR | NAME | SHIFT | NEWSHIFT | S/N | NAME | SHIFT | NEWSHIFT | S/N |
| 0 | 10880086 | 0.503401 | 0.00000 | 136.537 | 10880080 | 0.00000 | 0.503401 | 132.857 |
| 1 | 10880082 | 0.502007 | 0.00139397 | 143.199 | 10880087 | -0.000125522 | 0.503527 | 140.522 |
| 2 | 10880085 | 0.502861 | 0.000539958 | 136.796 | 10880084 | -0.00147854 | 0.504880 | 135.779 |
| 3 | 10880081 | 0.502977 | 0.000423968 | 135.348 | 10880083 | -0.00152408 | 0.504925 | 132.184 |