| Red | Green | Blue | |
| z | 17.64 | ||
| znorm | Inf | ||
| sky | -Inf | -Inf | -Inf |
| S/N | 23.8 | 42.6 | 46.6 |
| S/N(c) | 0.0 | 0.0 | 0.0 |
| SN(E/C) |
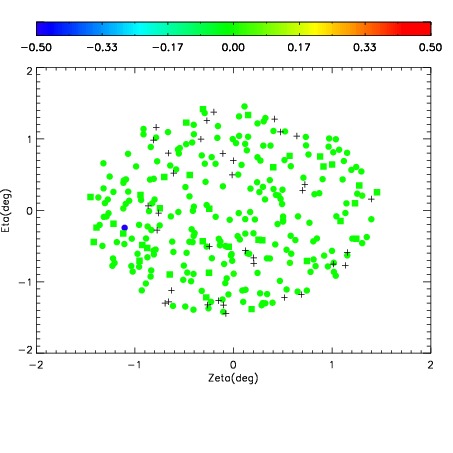
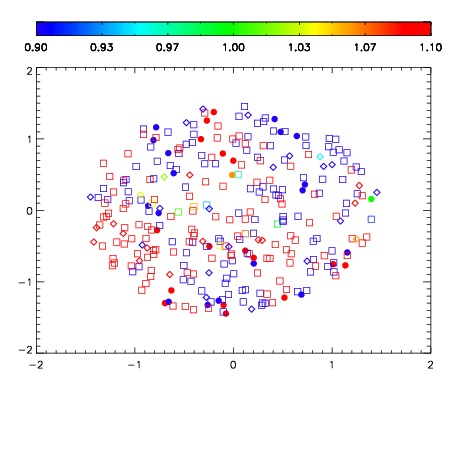
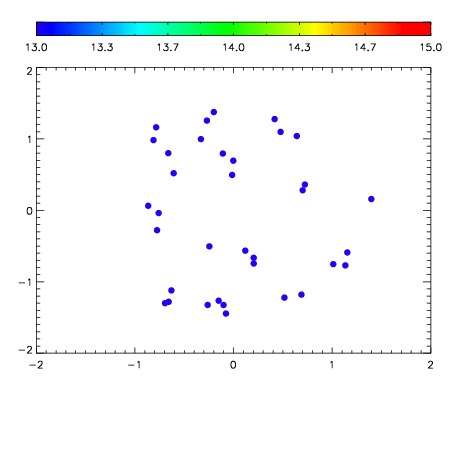

| Frame | Nreads | Zeropoints | Mag plots | Spatial mag deviation | Spatial sky 16325A emission deviations (filled: sky, open: star) | Spatial sky continuum emission | Spatial sky telluric CO2 absorption deviations (filled: H < 10) | |||||||||||||||||||||||
| 0 | 0 |
|
|
|
|
|
|
| IPAIR | NAME | SHIFT | NEWSHIFT | S/N | NAME | SHIFT | NEWSHIFT | S/N |
| 0 | 07020072 | 0.473067 | 0.00000 | 178.101 | 07020077 | 0.000141055 | 0.472926 | 183.131 |
| 1 | 07020071 | 0.472131 | 0.000935972 | 181.975 | 07020070 | 0.00000 | 0.473067 | 185.532 |
| 2 | 07020075 | 0.470111 | 0.00295597 | 177.944 | 07020073 | 0.00332309 | 0.469744 | 170.376 |
| 3 | 07020076 | 0.470483 | 0.00258398 | 172.896 | 07020074 | -0.00131950 | 0.474386 | 169.152 |