| Red | Green | Blue | |
| z | 17.64 | ||
| znorm | Inf | ||
| sky | -Inf | -Inf | -Inf |
| S/N | 24.8 | 44.3 | 48.9 |
| S/N(c) | 0.0 | 0.0 | 0.0 |
| SN(E/C) |
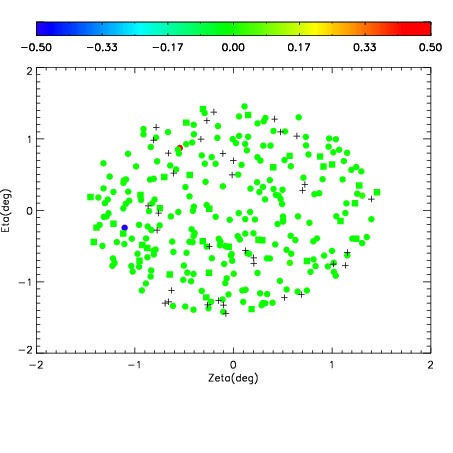

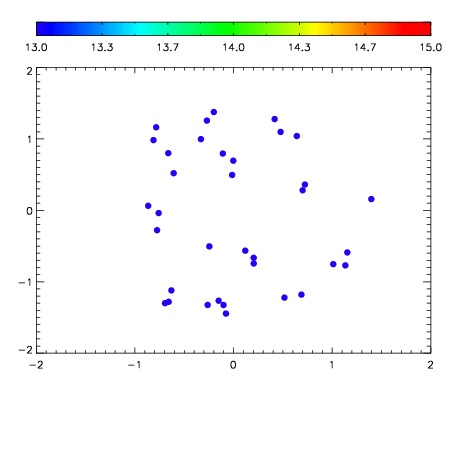

| Frame | Nreads | Zeropoints | Mag plots | Spatial mag deviation | Spatial sky 16325A emission deviations (filled: sky, open: star) | Spatial sky continuum emission | Spatial sky telluric CO2 absorption deviations (filled: H < 10) | |||||||||||||||||||||||
| 0 | 0 |
|
|
|
|
|
|
| IPAIR | NAME | SHIFT | NEWSHIFT | S/N | NAME | SHIFT | NEWSHIFT | S/N |
| 0 | 07830040 | 0.468598 | 0.00000 | 183.181 | 07830045 | -0.000190149 | 0.468788 | 177.400 |
| 1 | 07830039 | 0.468417 | 0.000181019 | 195.533 | 07830041 | 0.000422550 | 0.468175 | 191.383 |
| 2 | 07830043 | 0.466988 | 0.00161001 | 185.617 | 07830042 | 0.000210187 | 0.468388 | 190.635 |
| 3 | 07830044 | 0.467631 | 0.000966996 | 178.288 | 07830038 | 0.00000 | 0.468598 | 175.962 |