| Red | Green | Blue | |
| z | 17.64 | ||
| znorm | Inf | ||
| sky | -Inf | -Inf | -Inf |
| S/N | 24.4 | 44.5 | 48.6 |
| S/N(c) | 0.0 | 0.0 | 0.0 |
| SN(E/C) |
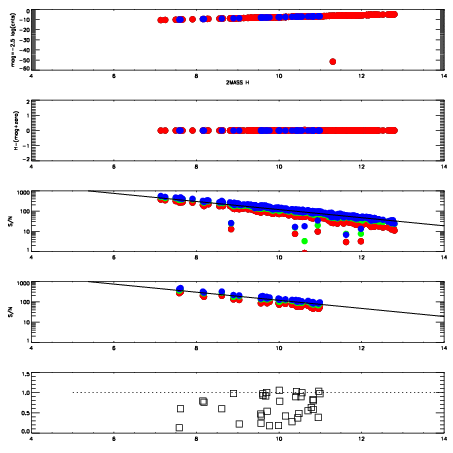
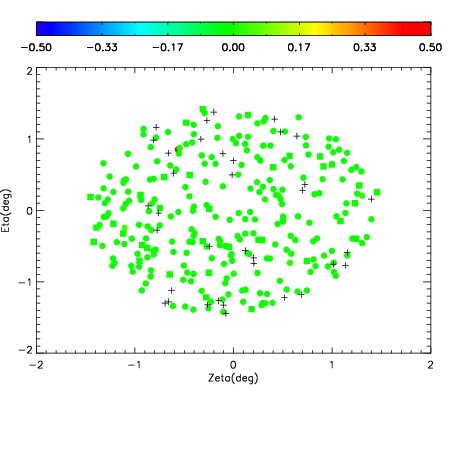
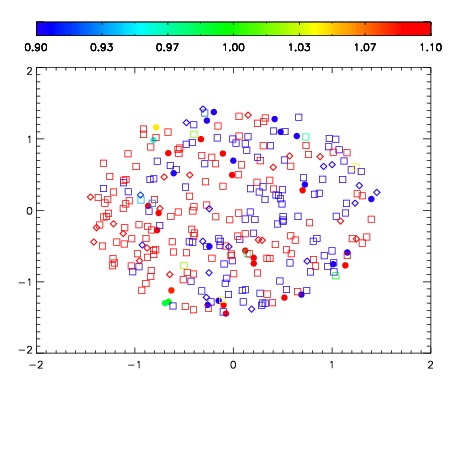
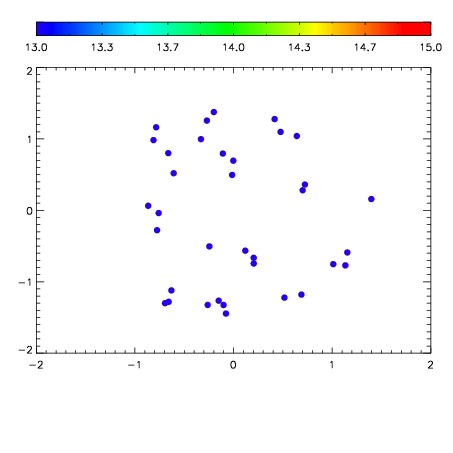

| Frame | Nreads | Zeropoints | Mag plots | Spatial mag deviation | Spatial sky 16325A emission deviations (filled: sky, open: star) | Spatial sky continuum emission | Spatial sky telluric CO2 absorption deviations (filled: H < 10) | |||||||||||||||||||||||
| 0 | 0 |
|
|
|
|
|
|
| IPAIR | NAME | SHIFT | NEWSHIFT | S/N | NAME | SHIFT | NEWSHIFT | S/N |
| 0 | 10810080 | 0.481937 | 0.00000 | 185.320 | 10810077 | -0.000500273 | 0.482437 | 172.475 |
| 1 | 10810075 | 0.480661 | 0.00127599 | 190.692 | 10810074 | 0.00000 | 0.481937 | 186.904 |
| 2 | 10810076 | 0.480598 | 0.00133899 | 184.250 | 10810078 | -0.000505613 | 0.482443 | 166.749 |
| 3 | 10810079 | 0.481641 | 0.000295997 | 175.261 | 10810081 | -0.00133616 | 0.483273 | 165.459 |