| Red | Green | Blue | |
| z | 17.64 | ||
| znorm | Inf | ||
| sky | -Inf | -Inf | -Inf |
| S/N | 28.5 | 48.3 | 54.2 |
| S/N(c) | 0.0 | 0.0 | 0.0 |
| SN(E/C) |
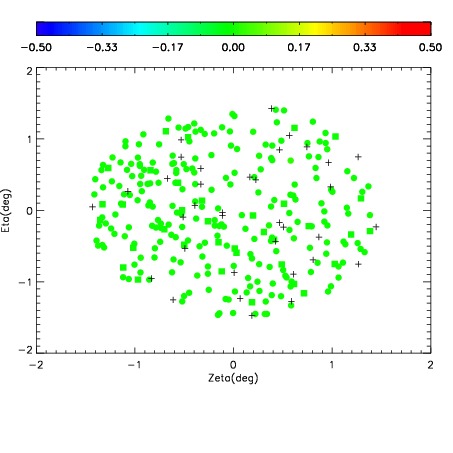
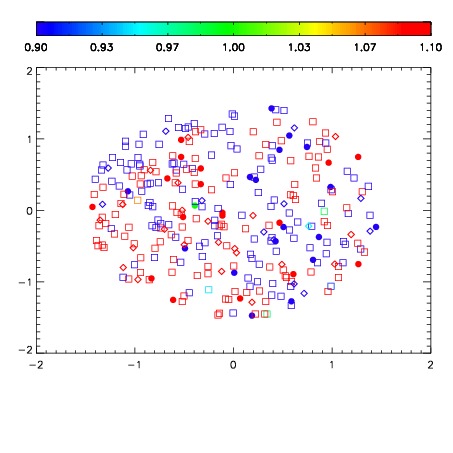
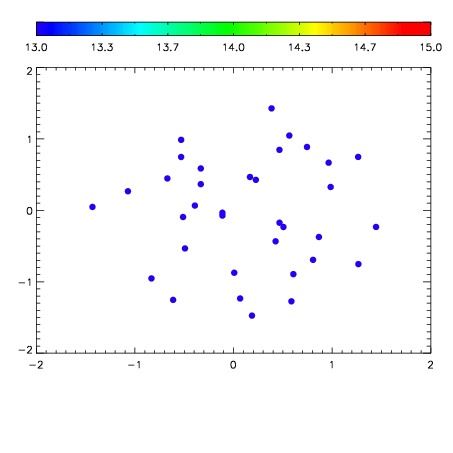

| Frame | Nreads | Zeropoints | Mag plots | Spatial mag deviation | Spatial sky 16325A emission deviations (filled: sky, open: star) | Spatial sky continuum emission | Spatial sky telluric CO2 absorption deviations (filled: H < 10) | |||||||||||||||||||||||
| 0 | 0 |
|
|
|
|
|
|
| IPAIR | NAME | SHIFT | NEWSHIFT | S/N | NAME | SHIFT | NEWSHIFT | S/N |
| 0 | 06980100 | 0.482023 | 0.00000 | 214.821 | 06980101 | 0.00195259 | 0.480070 | 216.991 |
| 1 | 06980099 | 0.480704 | 0.00131899 | 214.729 | 06980102 | 0.000397495 | 0.481625 | 210.508 |
| 2 | 06980103 | 0.479161 | 0.00286201 | 209.131 | 06980098 | 0.00000 | 0.482023 | 206.561 |
| 3 | 06980104 | 0.480657 | 0.00136599 | 206.268 | 06980105 | 0.000399513 | 0.481624 | 204.760 |