| Red | Green | Blue | |
| z | 17.64 | ||
| znorm | Inf | ||
| sky | -Inf | -Inf | -Inf |
| S/N | 31.4 | 52.0 | 59.5 |
| S/N(c) | 0.0 | 0.0 | 0.0 |
| SN(E/C) |
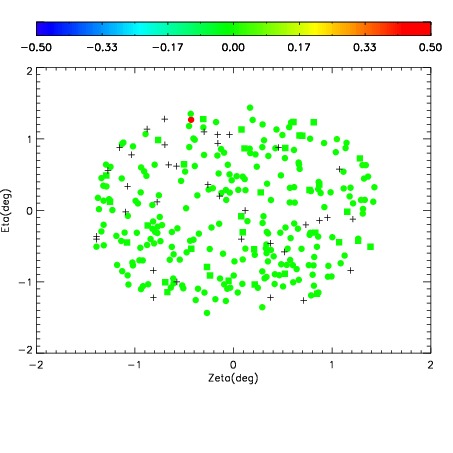
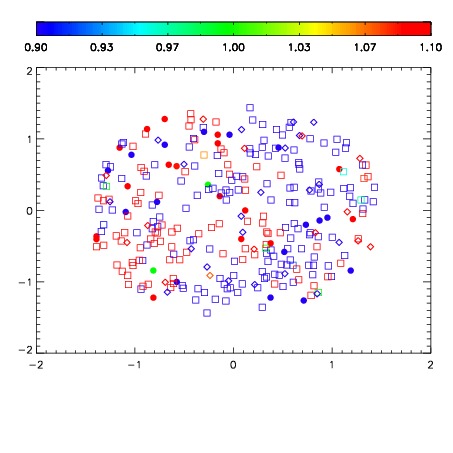
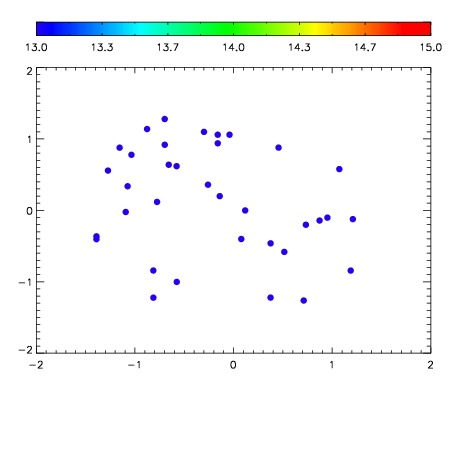

| Frame | Nreads | Zeropoints | Mag plots | Spatial mag deviation | Spatial sky 16325A emission deviations (filled: sky, open: star) | Spatial sky continuum emission | Spatial sky telluric CO2 absorption deviations (filled: H < 10) | |||||||||||||||||||||||
| 0 | 0 |
|
|
|
|
|
|
| IPAIR | NAME | SHIFT | NEWSHIFT | S/N | NAME | SHIFT | NEWSHIFT | S/N |
| 0 | 07000100 | 0.484443 | 0.00000 | 230.818 | 07000102 | 0.00292936 | 0.481514 | 234.857 |
| 1 | 07000104 | 0.481642 | 0.00280100 | 237.721 | 07000105 | 0.00164949 | 0.482794 | 240.432 |
| 2 | 07000103 | 0.479479 | 0.00496399 | 232.974 | 07000106 | 0.00128121 | 0.483162 | 235.237 |
| 3 | 07000108 | 0.481808 | 0.00263500 | 227.671 | 07000101 | 0.00148993 | 0.482953 | 229.282 |
| 4 | 07000107 | 0.479122 | 0.00532100 | 227.518 | 07000109 | 0.000726747 | 0.483716 | 225.990 |
| 5 | 07000099 | 0.481736 | 0.00270700 | 222.930 | 07000098 | 0.00000 | 0.484443 | 221.424 |