| Red | Green | Blue | |
| z | 17.64 | ||
| znorm | Inf | ||
| sky | -Inf | -Inf | -Inf |
| S/N | 24.8 | 40.5 | 43.9 |
| S/N(c) | 0.0 | 0.0 | 0.0 |
| SN(E/C) |
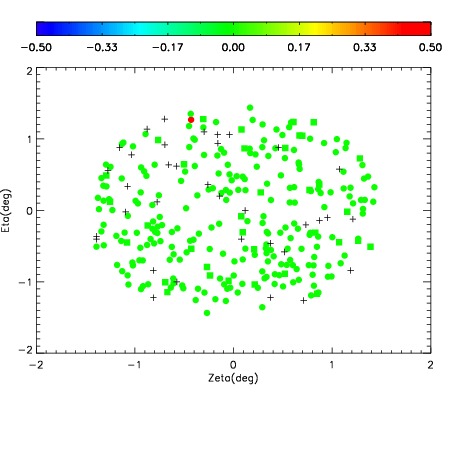
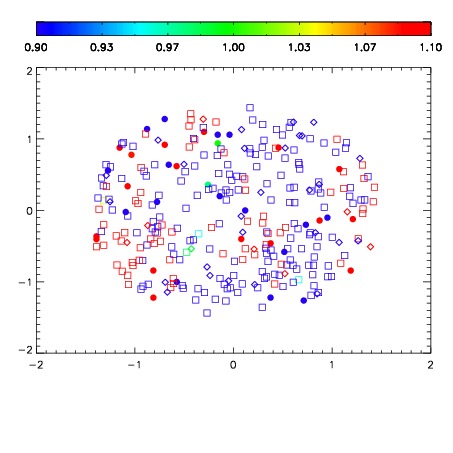
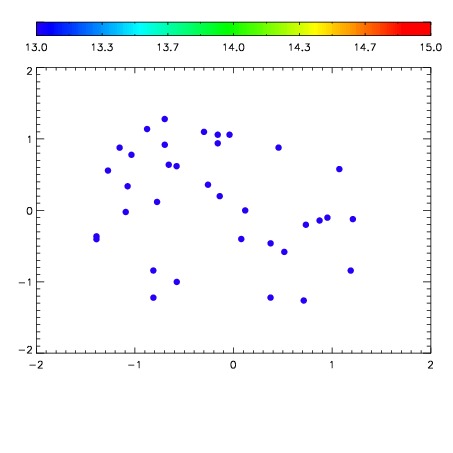

| Frame | Nreads | Zeropoints | Mag plots | Spatial mag deviation | Spatial sky 16325A emission deviations (filled: sky, open: star) | Spatial sky continuum emission | Spatial sky telluric CO2 absorption deviations (filled: H < 10) | |||||||||||||||||||||||
| 0 | 0 |
|
|
|
|
|
|
| IPAIR | NAME | SHIFT | NEWSHIFT | S/N | NAME | SHIFT | NEWSHIFT | S/N |
| 0 | 07630016 | 0.474027 | 0.00000 | 207.336 | 07630013 | 0.00537951 | 0.468648 | 200.407 |
| 1 | 07630015 | 0.471940 | 0.00208700 | 208.217 | 07630017 | 0.00587783 | 0.468149 | 200.800 |
| 2 | 07630012 | 0.473344 | 0.000683010 | 194.663 | 07630014 | 0.00302246 | 0.471005 | 198.029 |
| 3 | 07630011 | 0.471743 | 0.00228402 | 189.956 | 07630010 | 0.00000 | 0.474027 | 191.374 |