| Red | Green | Blue | |
| z | 17.64 | ||
| znorm | Inf | ||
| sky | -Inf | -Inf | -Inf |
| S/N | 21.1 | 35.8 | 41.5 |
| S/N(c) | 0.0 | 0.0 | 0.0 |
| SN(E/C) |
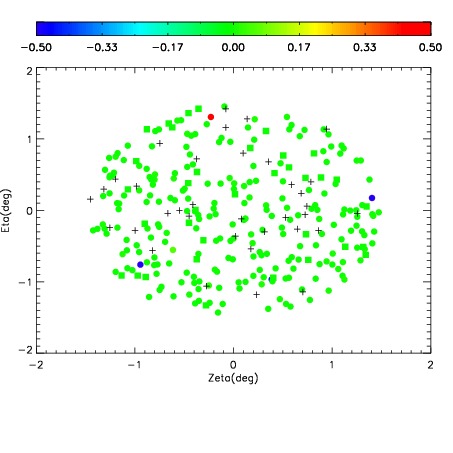
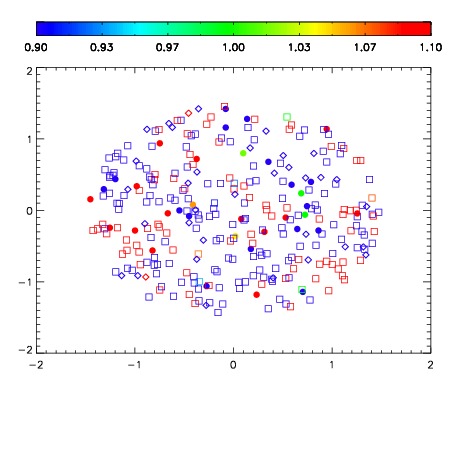
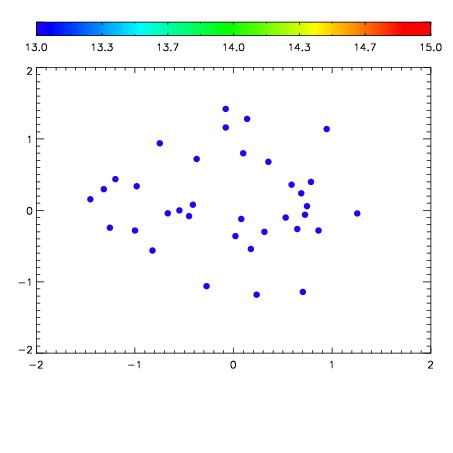

| Frame | Nreads | Zeropoints | Mag plots | Spatial mag deviation | Spatial sky 16325A emission deviations (filled: sky, open: star) | Spatial sky continuum emission | Spatial sky telluric CO2 absorption deviations (filled: H < 10) | |||||||||||||||||||||||
| 0 | 0 |
|
|
|
|
|
|
| IPAIR | NAME | SHIFT | NEWSHIFT | S/N | NAME | SHIFT | NEWSHIFT | S/N |
| 0 | 07630023 | 0.468927 | 0.00000 | 181.284 | 07630021 | 0.00000 | 0.468927 | 169.076 |
| 1 | 07630026 | 0.466083 | 0.00284401 | 187.496 | 07630025 | -0.00199023 | 0.470917 | 191.320 |
| 2 | 07630027 | 0.466845 | 0.00208199 | 186.099 | 07630028 | 0.00122970 | 0.467697 | 182.564 |
| 3 | 07630022 | 0.468044 | 0.000882983 | 182.290 | 07630024 | -0.00187474 | 0.470802 | 177.067 |