| Red | Green | Blue | |
| z | 17.64 | ||
| znorm | Inf | ||
| sky | -NaN | -Inf | -Inf |
| S/N | 24.7 | 40.5 | 44.2 |
| S/N(c) | 0.0 | 0.0 | 0.0 |
| SN(E/C) |
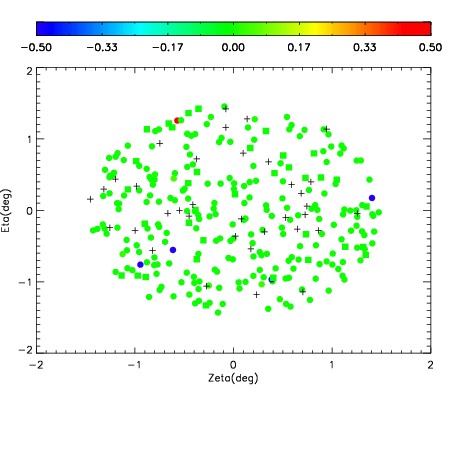
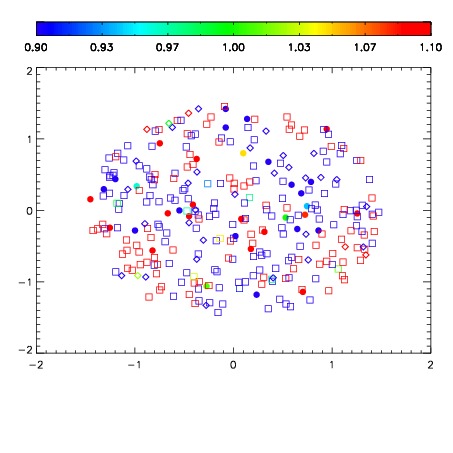
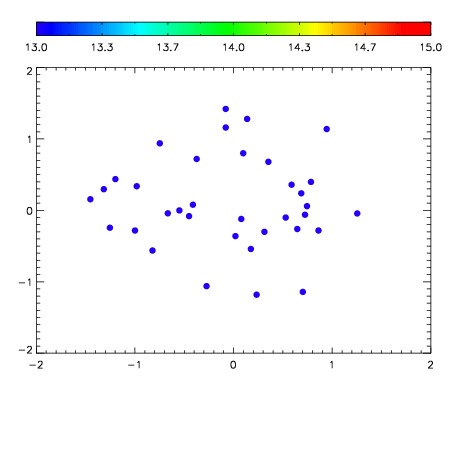

| Frame | Nreads | Zeropoints | Mag plots | Spatial mag deviation | Spatial sky 16325A emission deviations (filled: sky, open: star) | Spatial sky continuum emission | Spatial sky telluric CO2 absorption deviations (filled: H < 10) | |||||||||||||||||||||||
| 0 | 0 |
|
|
|
|
|
|
| IPAIR | NAME | SHIFT | NEWSHIFT | S/N | NAME | SHIFT | NEWSHIFT | S/N |
| 0 | 07800017 | 0.471852 | 0.00000 | 207.789 | 07800018 | 0.00119545 | 0.470657 | 204.149 |
| 1 | 07800016 | 0.470497 | 0.00135499 | 209.983 | 07800014 | -0.000762751 | 0.472615 | 212.384 |
| 2 | 07800013 | 0.468326 | 0.00352600 | 209.155 | 07800015 | -0.00137109 | 0.473223 | 205.341 |
| 3 | 07800012 | 0.467935 | 0.00391701 | 172.973 | 07800011 | 0.00000 | 0.471852 | 177.250 |