| Red | Green | Blue | |
| z | 17.64 | ||
| znorm | Inf | ||
| sky | -NaN | -Inf | -Inf |
| S/N | 20.5 | 36.2 | 45.0 |
| S/N(c) | 0.0 | 0.0 | 0.0 |
| SN(E/C) |
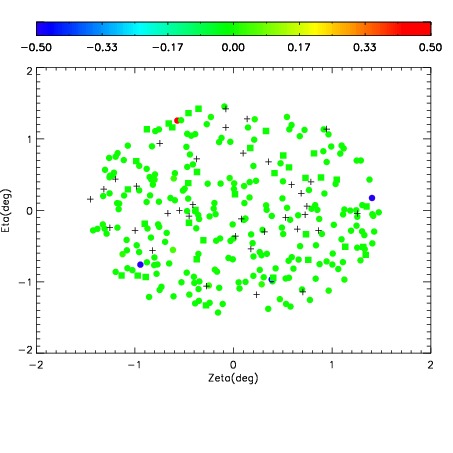
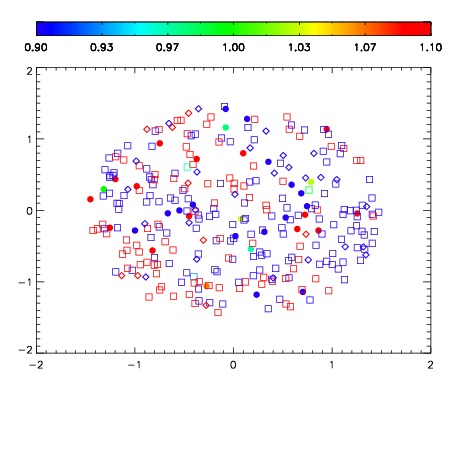
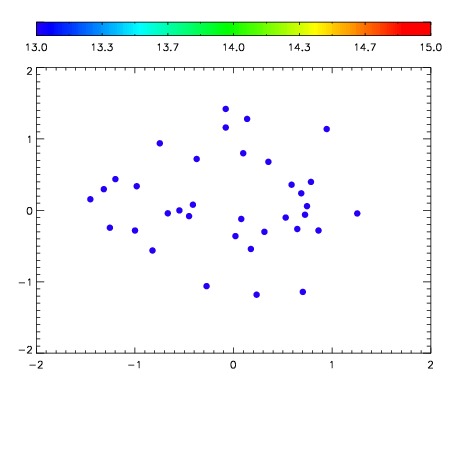

| Frame | Nreads | Zeropoints | Mag plots | Spatial mag deviation | Spatial sky 16325A emission deviations (filled: sky, open: star) | Spatial sky continuum emission | Spatial sky telluric CO2 absorption deviations (filled: H < 10) | |||||||||||||||||||||||
| 0 | 0 |
|
|
|
|
|
|
| IPAIR | NAME | SHIFT | NEWSHIFT | S/N | NAME | SHIFT | NEWSHIFT | S/N |
| 0 | 08140039 | 0.508773 | 0.00000 | 192.274 | 08140041 | -0.00564264 | 0.514416 | 190.448 |
| 1 | 08140038 | 0.507587 | 0.00118601 | 185.813 | 08140040 | -0.00396451 | 0.512738 | 188.938 |
| 2 | 08140042 | 0.505267 | 0.00350600 | 179.635 | 08140044 | -0.00315095 | 0.511924 | 180.093 |
| 3 | 08140043 | 0.506312 | 0.00246102 | 175.555 | 08140037 | 0.00000 | 0.508773 | 176.718 |