| Red | Green | Blue | |
| z | 17.64 | ||
| znorm | Inf | ||
| sky | -Inf | -Inf | -Inf |
| S/N | 23.6 | 40.3 | 44.5 |
| S/N(c) | 0.0 | 0.0 | 0.0 |
| SN(E/C) |
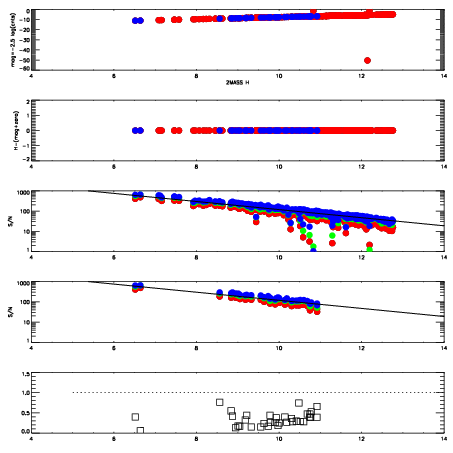
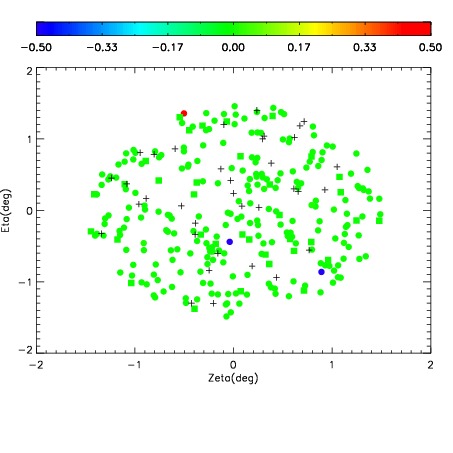
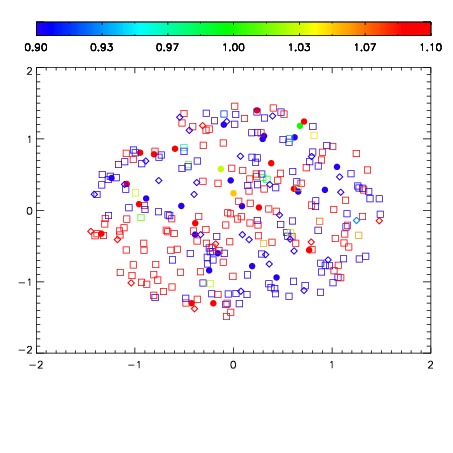


| Frame | Nreads | Zeropoints | Mag plots | Spatial mag deviation | Spatial sky 16325A emission deviations (filled: sky, open: star) | Spatial sky continuum emission | Spatial sky telluric CO2 absorption deviations (filled: H < 10) | |||||||||||||||||||||||
| 0 | 0 |
|
|
|
|
|
|
| IPAIR | NAME | SHIFT | NEWSHIFT | S/N | NAME | SHIFT | NEWSHIFT | S/N |
| 0 | 07030077 | 0.476619 | 0.00000 | 223.642 | 07030071 | 0.00000 | 0.476619 | 222.468 |
| 1 | 07030072 | 0.474176 | 0.00244302 | 237.500 | 07030074 | 0.000503086 | 0.476116 | 233.201 |
| 2 | 07030073 | 0.474709 | 0.00191000 | 225.685 | 07030075 | 0.000373855 | 0.476245 | 229.594 |
| 3 | 07030076 | 0.476180 | 0.000439018 | 215.358 | 07030078 | 0.00294623 | 0.473673 | 215.855 |