| Red | Green | Blue | |
| z | 17.64 | ||
| znorm | Inf | ||
| sky | -Inf | -Inf | -Inf |
| S/N | 24.1 | 44.2 | 49.4 |
| S/N(c) | 0.0 | 0.0 | 0.0 |
| SN(E/C) |

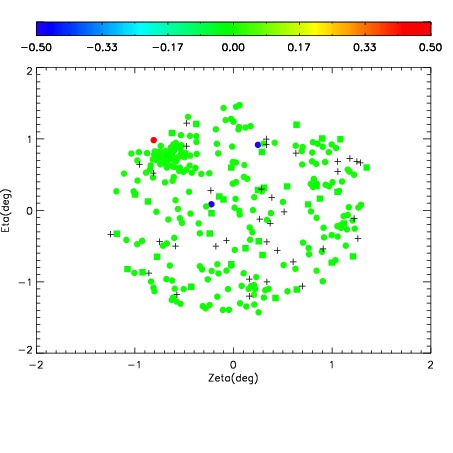
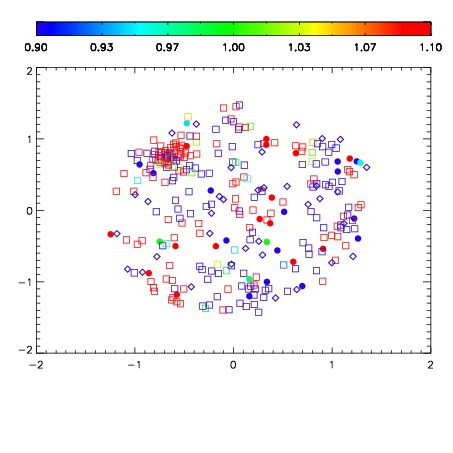
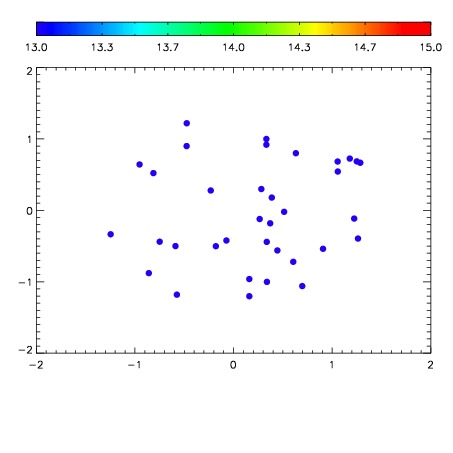

| Frame | Nreads | Zeropoints | Mag plots | Spatial mag deviation | Spatial sky 16325A emission deviations (filled: sky, open: star) | Spatial sky continuum emission | Spatial sky telluric CO2 absorption deviations (filled: H < 10) | |||||||||||||||||||||||
| 0 | 0 |
|
|
|
|
|
|
| IPAIR | NAME | SHIFT | NEWSHIFT | S/N | NAME | SHIFT | NEWSHIFT | S/N |
| 0 | 07610065 | 0.486352 | 0.00000 | 209.222 | 07610066 | -0.000300796 | 0.486653 | 207.035 |
| 1 | 07610064 | 0.484749 | 0.00160301 | 196.970 | 07610063 | -0.00125625 | 0.487608 | 199.187 |
| 2 | 07610060 | 0.485323 | 0.00102898 | 191.676 | 07610059 | 0.00000 | 0.486352 | 195.648 |
| 3 | 07610061 | 0.485378 | 0.000974000 | 190.882 | 07610062 | 0.000103142 | 0.486249 | 191.520 |