| Red | Green | Blue | |
| z | 17.64 | ||
| znorm | Inf | ||
| sky | -Inf | -Inf | -Inf |
| S/N | 17.4 | 35.8 | 37.6 |
| S/N(c) | 0.0 | 0.0 | 0.0 |
| SN(E/C) |


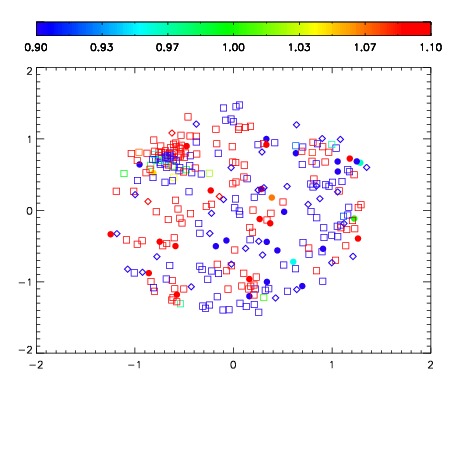


| Frame | Nreads | Zeropoints | Mag plots | Spatial mag deviation | Spatial sky 16325A emission deviations (filled: sky, open: star) | Spatial sky continuum emission | Spatial sky telluric CO2 absorption deviations (filled: H < 10) | |||||||||||||||||||||||
| 0 | 0 |
|
|
|
|
|
|
| IPAIR | NAME | SHIFT | NEWSHIFT | S/N | NAME | SHIFT | NEWSHIFT | S/N |
| 0 | 07840059 | 0.477285 | 0.00000 | 179.500 | 07840057 | -0.000989009 | 0.478274 | 168.715 |
| 1 | 07840058 | 0.477039 | 0.000245988 | 176.190 | 07840060 | -0.000109048 | 0.477394 | 168.095 |
| 2 | 07840054 | 0.475848 | 0.00143701 | 161.175 | 07840056 | -0.000789528 | 0.478075 | 150.765 |
| 3 | 07840055 | 0.477060 | 0.000225008 | 149.028 | 07840053 | 0.00000 | 0.477285 | 150.061 |