| Red | Green | Blue | |
| z | 17.64 | ||
| znorm | Inf | ||
| sky | -Inf | -Inf | -Inf |
| S/N | 26.6 | 50.8 | 57.9 |
| S/N(c) | 0.0 | 0.0 | 0.0 |
| SN(E/C) |

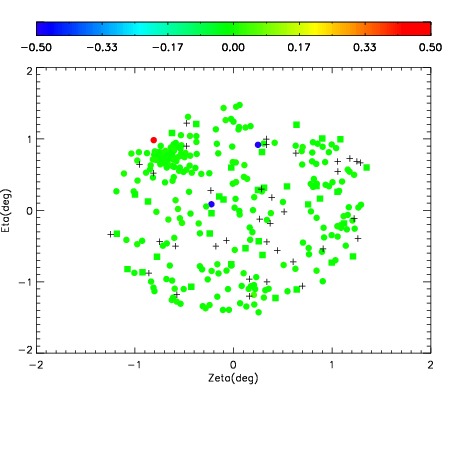
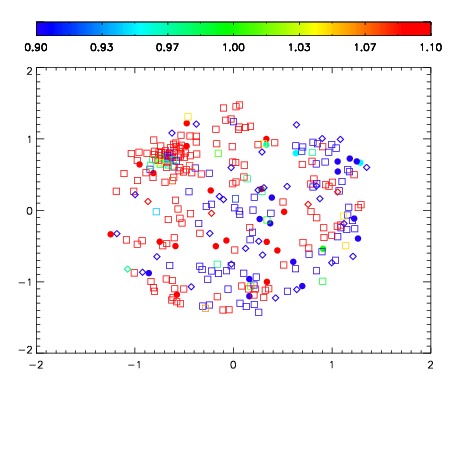
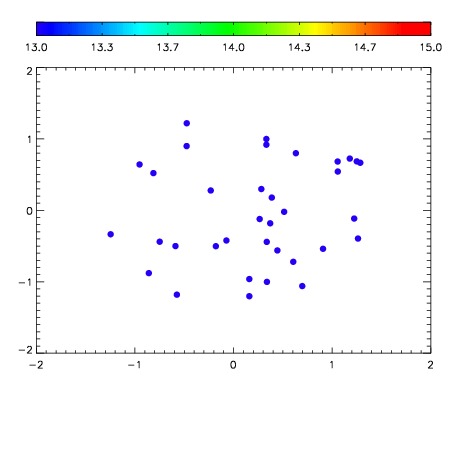

| Frame | Nreads | Zeropoints | Mag plots | Spatial mag deviation | Spatial sky 16325A emission deviations (filled: sky, open: star) | Spatial sky continuum emission | Spatial sky telluric CO2 absorption deviations (filled: H < 10) | |||||||||||||||||||||||
| 0 | 0 |
|
|
|
|
|
|
| IPAIR | NAME | SHIFT | NEWSHIFT | S/N | NAME | SHIFT | NEWSHIFT | S/N |
| 0 | 07890061 | 0.476377 | 0.00000 | 215.993 | 07890063 | 5.18980e-05 | 0.476325 | 213.104 |
| 1 | 07890068 | 0.469640 | 0.00673702 | 221.363 | 07890066 | 0.00198873 | 0.474388 | 215.004 |
| 2 | 07890065 | 0.470283 | 0.00609401 | 214.864 | 07890067 | 0.00157913 | 0.474798 | 209.420 |
| 3 | 07890064 | 0.469620 | 0.00675702 | 214.104 | 07890062 | 0.00126740 | 0.475110 | 207.749 |
| 4 | 07890060 | 0.475000 | 0.00137702 | 212.368 | 07890059 | 0.00000 | 0.476377 | 201.511 |