| Red | Green | Blue | |
| z | 17.64 | ||
| znorm | Inf | ||
| sky | -Inf | -Inf | -Inf |
| S/N | 24.1 | 43.3 | 50.1 |
| S/N(c) | 0.0 | 0.0 | 0.0 |
| SN(E/C) |
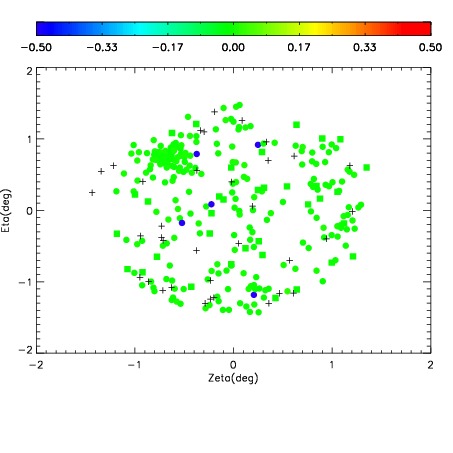
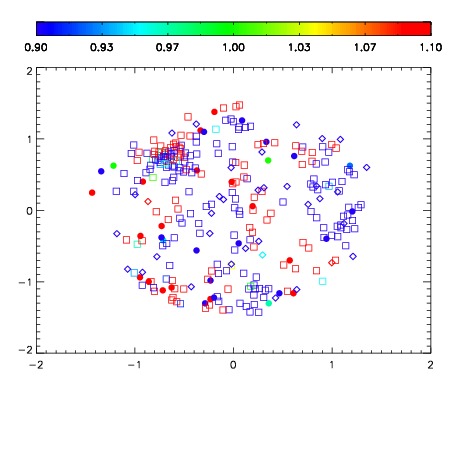
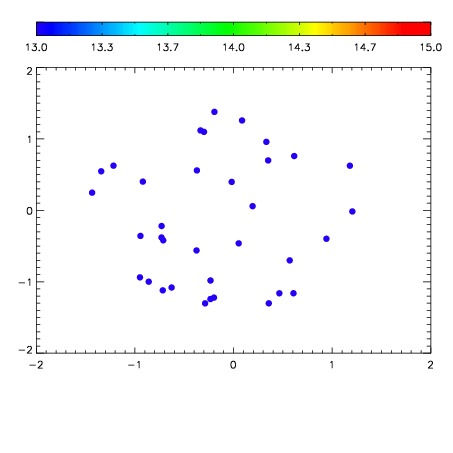

| Frame | Nreads | Zeropoints | Mag plots | Spatial mag deviation | Spatial sky 16325A emission deviations (filled: sky, open: star) | Spatial sky continuum emission | Spatial sky telluric CO2 absorption deviations (filled: H < 10) | |||||||||||||||||||||||
| 0 | 0 |
|
|
|
|
|
|
| IPAIR | NAME | SHIFT | NEWSHIFT | S/N | NAME | SHIFT | NEWSHIFT | S/N |
| 0 | 07620050 | 0.488294 | 0.00000 | 182.107 | 07620052 | 0.00177354 | 0.486520 | 173.381 |
| 1 | 07620054 | 0.485606 | 0.00268799 | 189.336 | 07620055 | 0.000881515 | 0.487412 | 200.797 |
| 2 | 07620049 | 0.487768 | 0.000526011 | 187.212 | 07620051 | 0.00269125 | 0.485603 | 192.843 |
| 3 | 07620053 | 0.485235 | 0.00305900 | 175.155 | 07620048 | 0.00000 | 0.488294 | 171.042 |