| Red | Green | Blue | |
| z | 17.64 | ||
| znorm | Inf | ||
| sky | -Inf | -Inf | -Inf |
| S/N | 26.5 | 46.0 | 51.9 |
| S/N(c) | 0.0 | 0.0 | 0.0 |
| SN(E/C) |
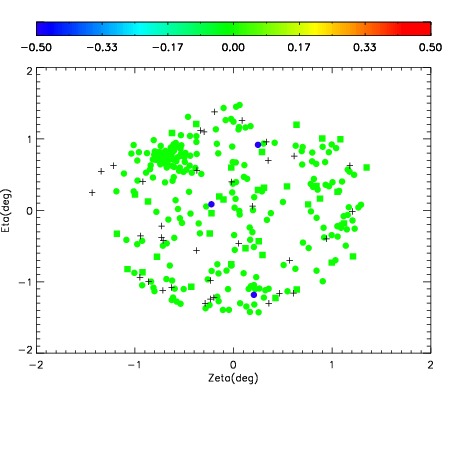

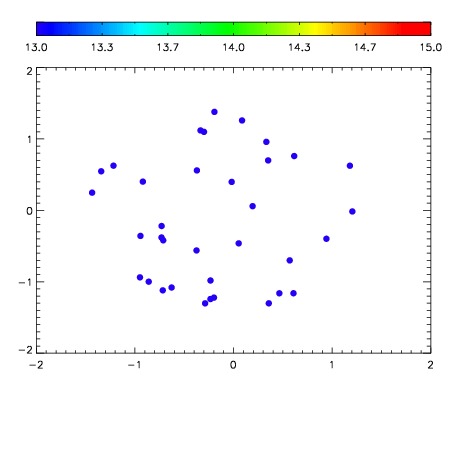

| Frame | Nreads | Zeropoints | Mag plots | Spatial mag deviation | Spatial sky 16325A emission deviations (filled: sky, open: star) | Spatial sky continuum emission | Spatial sky telluric CO2 absorption deviations (filled: H < 10) | |||||||||||||||||||||||
| 0 | 0 |
|
|
|
|
|
|
| IPAIR | NAME | SHIFT | NEWSHIFT | S/N | NAME | SHIFT | NEWSHIFT | S/N |
| 0 | 07850076 | 0.470484 | 0.00000 | 208.297 | 07850077 | 0.00353371 | 0.466950 | 209.859 |
| 1 | 07850075 | 0.469739 | 0.000744998 | 217.341 | 07850074 | 0.00204539 | 0.468439 | 211.105 |
| 2 | 07850072 | 0.469985 | 0.000498980 | 207.535 | 07850073 | 0.00218515 | 0.468299 | 206.570 |
| 3 | 07850071 | 0.469941 | 0.000542998 | 207.197 | 07850070 | 0.00000 | 0.470484 | 197.745 |