| Red | Green | Blue | |
| z | 17.64 | ||
| znorm | Inf | ||
| sky | -Inf | -Inf | -Inf |
| S/N | 24.7 | 44.2 | 47.7 |
| S/N(c) | 0.0 | 0.0 | 0.0 |
| SN(E/C) |

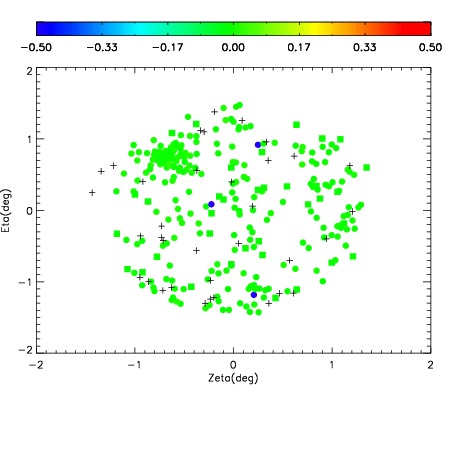
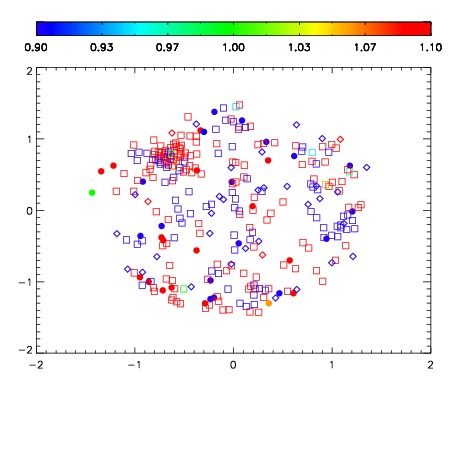
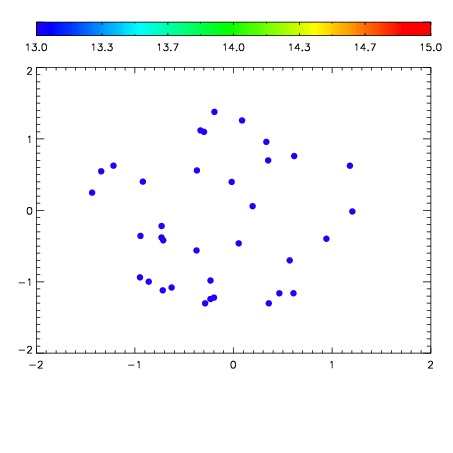

| Frame | Nreads | Zeropoints | Mag plots | Spatial mag deviation | Spatial sky 16325A emission deviations (filled: sky, open: star) | Spatial sky continuum emission | Spatial sky telluric CO2 absorption deviations (filled: H < 10) | |||||||||||||||||||||||
| 0 | 0 |
|
|
|
|
|
|
| IPAIR | NAME | SHIFT | NEWSHIFT | S/N | NAME | SHIFT | NEWSHIFT | S/N |
| 0 | 07900053 | 0.468269 | 0.00000 | 192.681 | 07900055 | 0.000973018 | 0.467296 | 188.648 |
| 1 | 07900050 | 0.467993 | 0.000275999 | 208.817 | 07900051 | 0.00138553 | 0.466883 | 203.949 |
| 2 | 07900049 | 0.467462 | 0.000806987 | 204.212 | 07900048 | 0.00000 | 0.468269 | 197.239 |
| 3 | 07900054 | 0.467716 | 0.000552982 | 195.737 | 07900052 | 0.00112510 | 0.467144 | 195.846 |