| Red | Green | Blue | |
| z | 17.64 | ||
| znorm | Inf | ||
| sky | -Inf | -Inf | -Inf |
| S/N | 15.3 | 28.2 | 32.9 |
| S/N(c) | 0.0 | 0.0 | 0.0 |
| SN(E/C) |
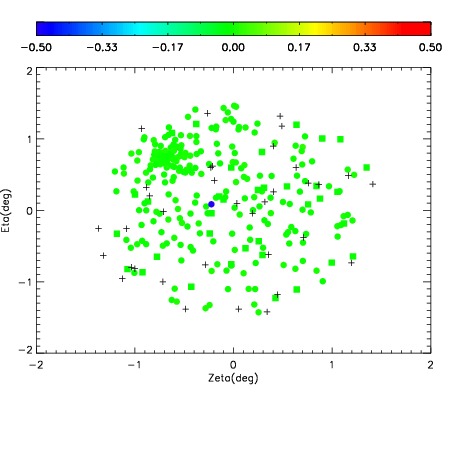
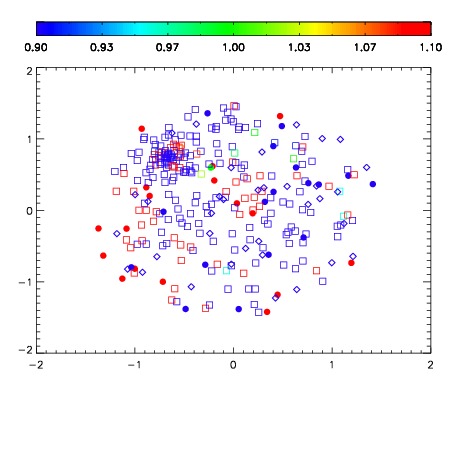
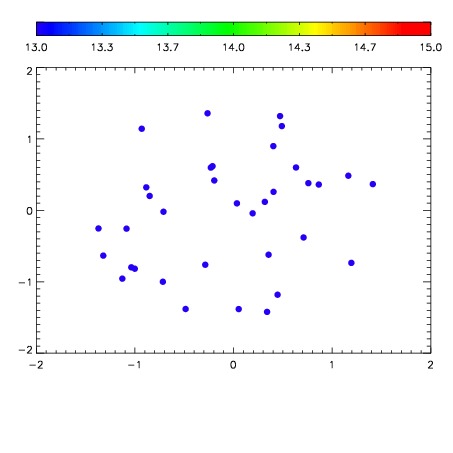

| Frame | Nreads | Zeropoints | Mag plots | Spatial mag deviation | Spatial sky 16325A emission deviations (filled: sky, open: star) | Spatial sky continuum emission | Spatial sky telluric CO2 absorption deviations (filled: H < 10) | |||||||||||||||||||||||
| 0 | 0 |
|
|
|
|
|
|
| IPAIR | NAME | SHIFT | NEWSHIFT | S/N | NAME | SHIFT | NEWSHIFT | S/N |
| 0 | 07630055 | 0.485518 | 0.00000 | 97.5843 | 07630054 | 0.00000 | 0.485518 | 91.2674 |
| 1 | 07630056 | 0.485353 | 0.000165015 | 168.714 | 07630057 | -0.000785265 | 0.486303 | 187.409 |
| 2 | 07630059 | 0.484633 | 0.000885010 | 142.344 | 07630058 | -0.00118233 | 0.486700 | 164.989 |