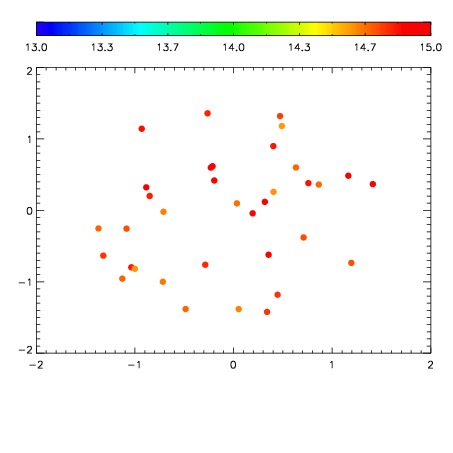
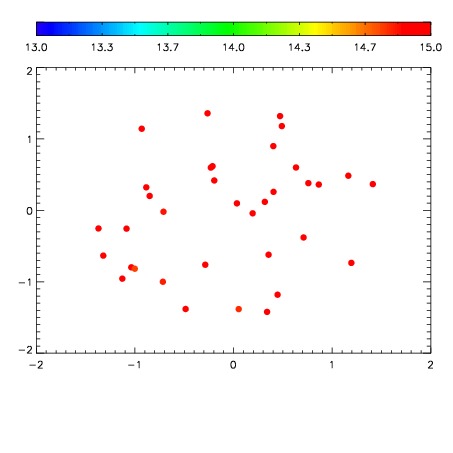
| Frame | Nreads | Zeropoints | Mag plots
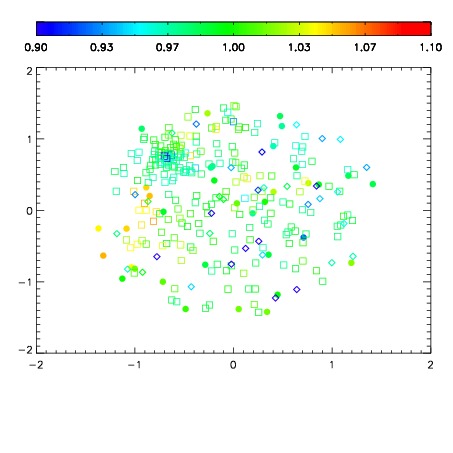
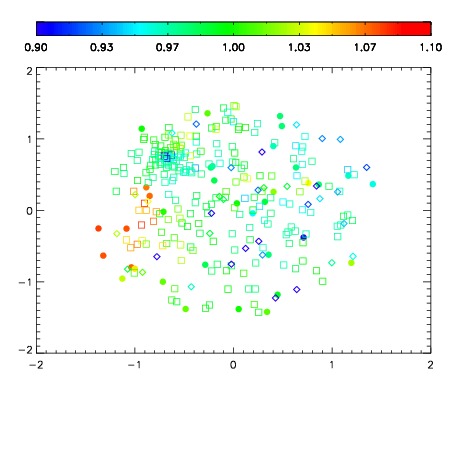
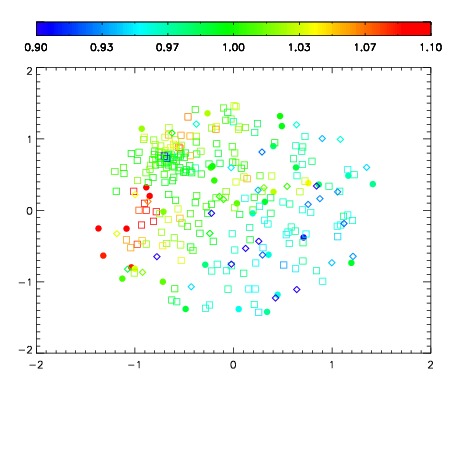
| Spatial mag deviation
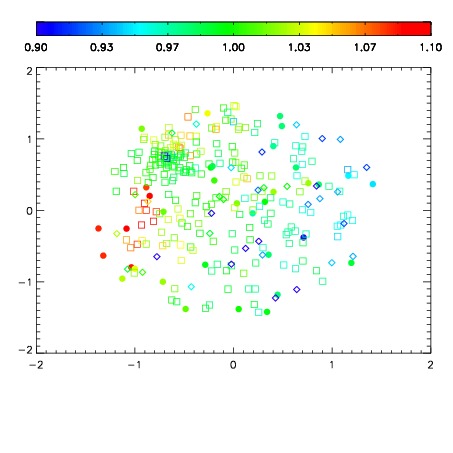
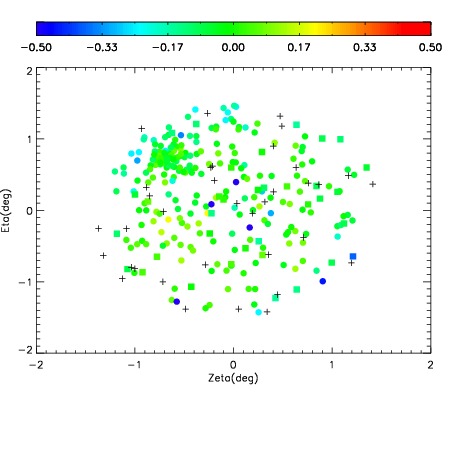
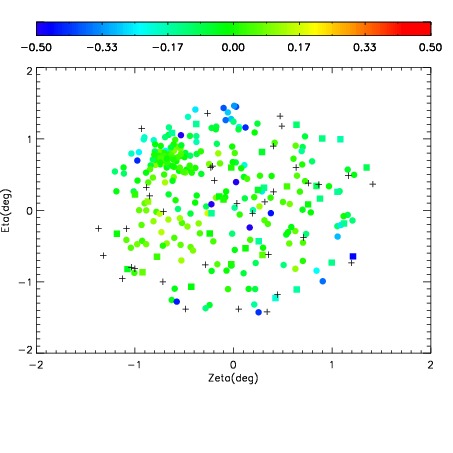
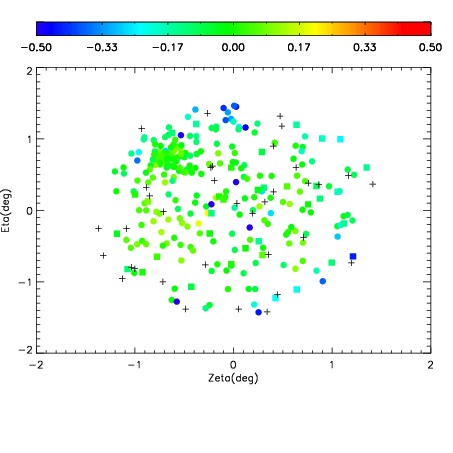
| Spatial sky 16325A emission deviations (filled: sky, open: star)
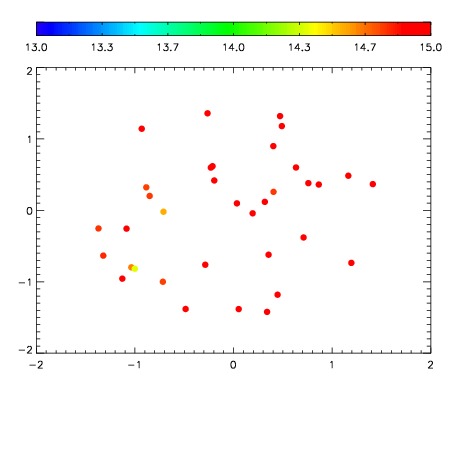
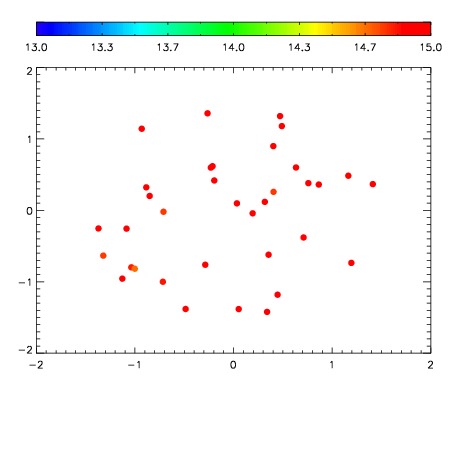
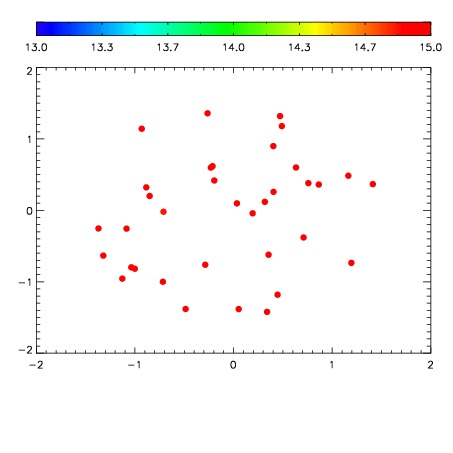
| Spatial sky continuum emission
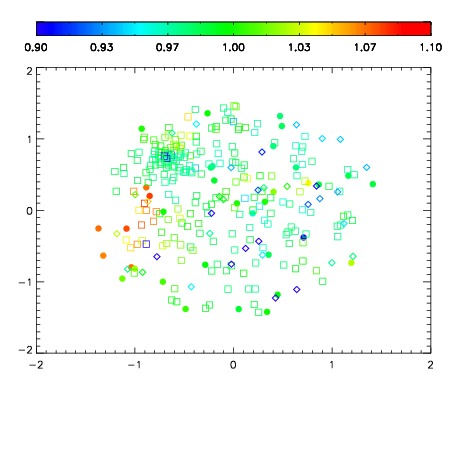
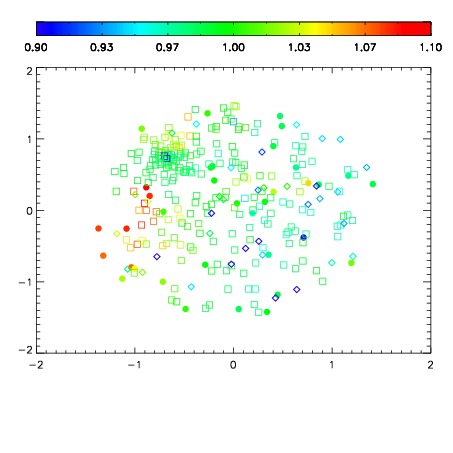
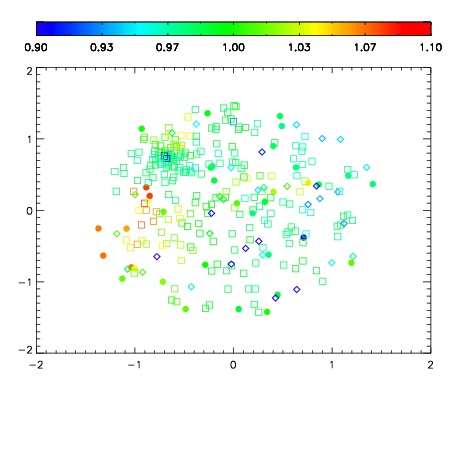
| Spatial sky telluric CO2 absorption deviations (filled: H < 10)
|
| 7870075
| 47
| | Red | Green | Blue
| | z | | 19.07
| | znorm | | 14.89
| | sky | 15.8 | 15.0 | 14.4
| | S/N | 16.7 | 26.5 | 30.0
| | S/N(c) | 15.2 | 25.8 | 29.4
| | SN(E/C) 0.35
|
| 
| 
| 
| 
| 
|
| 7870076
| 47
| | Red | Green | Blue
| | z | | 19.13
| | znorm | | 14.95
| | sky | 15.8 | 15.1 | 15.5
| | S/N | 16.9 | 27.2 | 30.0
| | S/N(c) | 15.5 | 26.3 | 29.1
| | SN(E/C) 0.36
|
| 
| 
| 
| 
| 
|
| 7870077
| 47
| | Red | Green | Blue
| | z | | 19.14
| | znorm | | 14.96
| | sky | 15.4 | 14.8 | 15.0
| | S/N | 17.0 | 27.5 | 29.6
| | S/N(c) | 15.6 | 26.6 | 28.7
| | SN(E/C) 0.35
|
| 
| 
| 
| 
| 
|
| 7870078
| 47
| | Red | Green | Blue
| | z | | 19.10
| | znorm | | 14.92
| | sky | 15.5 | 15.0 | 15.1
| | S/N | 16.6 | 27.0 | 28.7
| | S/N(c) | 15.1 | 26.2 | 27.9
| | SN(E/C) 0.37
|
| 
| 
| 
| 
| 
|
| 7870079
| 47
| | Red | Green | Blue
| | z | | 19.10
| | znorm | | 14.92
| | sky | 15.6 | 15.2 | 15.1
| | S/N | 16.4 | 26.8 | 28.2
| | S/N(c) | 14.8 | 25.8 | 27.4
| | SN(E/C) 0.37
|
| 
| 
| 
| 
| 
|
| 7870080
| 47
| | Red | Green | Blue
| | z | | 19.09
| | znorm | | 14.91
| | sky | 15.4 | 15.2 | 15.1
| | S/N | 16.5 | 26.7 | 28.1
| | S/N(c) | 14.8 | 25.7 | 27.3
| | SN(E/C) 0.36
|
| 
| 
| 
| 
| 
|
| 7870081
| 47
| | Red | Green | Blue
| | z | | 19.09
| | znorm | | 14.91
| | sky | 15.2 | 15.1 | 15.1
| | S/N | 16.6 | 27.2 | 28.7
| | S/N(c) | 15.0 | 26.1 | 27.7
| | SN(E/C) 0.38
|
| 
| 
| 
| 
| 
|
| 7870082
| 47
| | Red | Green | Blue
| | z | | 19.09
| | znorm | | 14.91
| | sky | 15.7 | 15.3 | 15.1
| | S/N | 16.6 | 27.2 | 28.5
| | S/N(c) | 15.0 | 26.2 | 27.6
| | SN(E/C) 0.36
|
| 
| 
| 
| 
| 
|