| Red | Green | Blue | |
| z | 17.64 | ||
| znorm | Inf | ||
| sky | -NaN | -Inf | -Inf |
| S/N | 30.1 | 52.0 | 55.7 |
| S/N(c) | 0.0 | 0.0 | 0.0 |
| SN(E/C) |
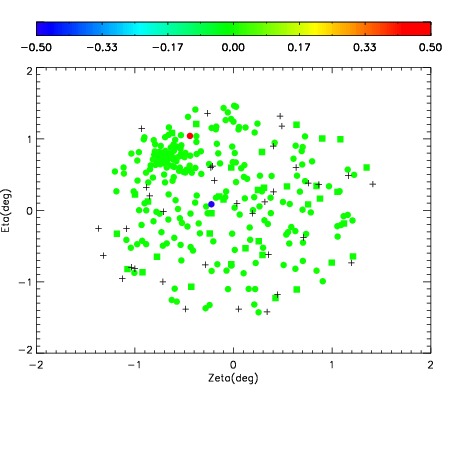
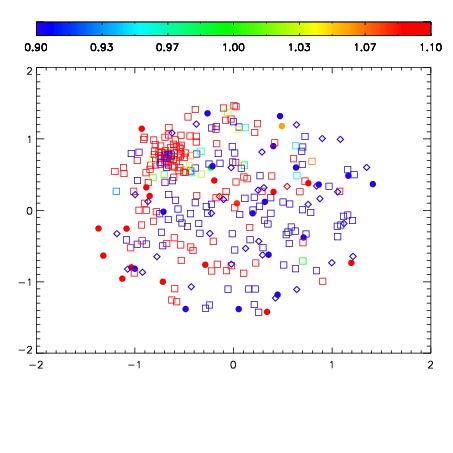
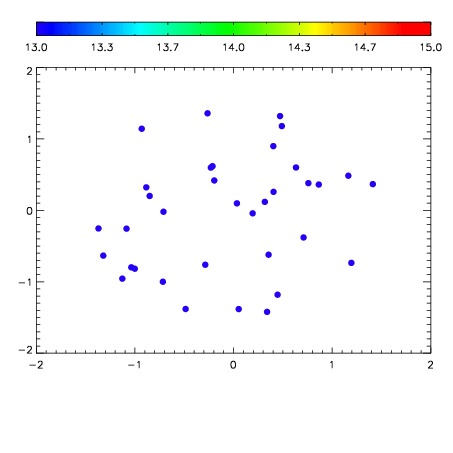

| Frame | Nreads | Zeropoints | Mag plots | Spatial mag deviation | Spatial sky 16325A emission deviations (filled: sky, open: star) | Spatial sky continuum emission | Spatial sky telluric CO2 absorption deviations (filled: H < 10) | |||||||||||||||||||||||
| 0 | 0 |
|
|
|
|
|
|
| IPAIR | NAME | SHIFT | NEWSHIFT | S/N | NAME | SHIFT | NEWSHIFT | S/N |
| 0 | 07870077 | 0.469485 | 0.00000 | 194.581 | 07870078 | 0.000552713 | 0.468932 | 190.659 |
| 1 | 07870076 | 0.468776 | 0.000709027 | 192.648 | 07870079 | -0.000236669 | 0.469722 | 190.030 |
| 2 | 07870080 | 0.467709 | 0.00177601 | 188.309 | 07870082 | 3.91351e-05 | 0.469446 | 187.545 |
| 3 | 07870081 | 0.468116 | 0.00136903 | 185.877 | 07870075 | 0.00000 | 0.469485 | 187.259 |