| Red | Green | Blue | |
| z | 17.64 | ||
| znorm | Inf | ||
| sky | -NaN | -Inf | -Inf |
| S/N | 31.0 | 51.6 | 56.5 |
| S/N(c) | 0.0 | 0.0 | 0.0 |
| SN(E/C) |
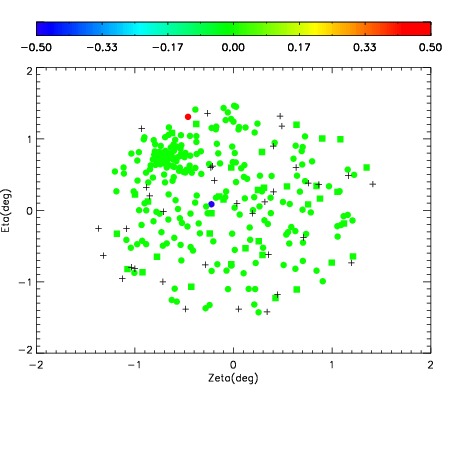
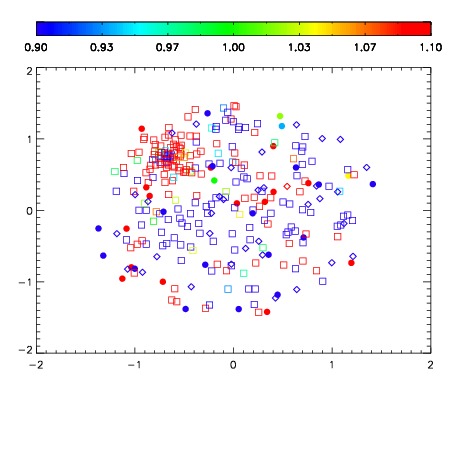
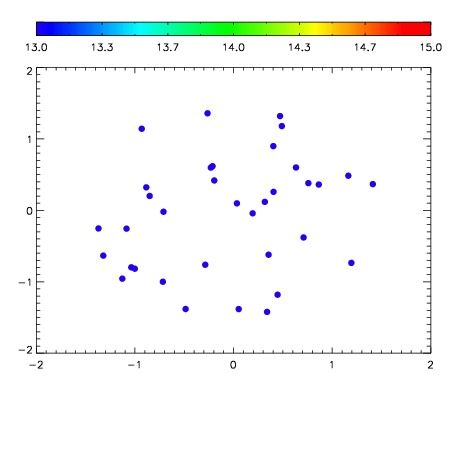

| Frame | Nreads | Zeropoints | Mag plots | Spatial mag deviation | Spatial sky 16325A emission deviations (filled: sky, open: star) | Spatial sky continuum emission | Spatial sky telluric CO2 absorption deviations (filled: H < 10) | |||||||||||||||||||||||
| 0 | 0 |
|
|
|
|
|
|
| IPAIR | NAME | SHIFT | NEWSHIFT | S/N | NAME | SHIFT | NEWSHIFT | S/N |
| 0 | 07910040 | 0.502689 | 0.00000 | 216.191 | 07910045 | -0.000148810 | 0.502838 | 214.345 |
| 1 | 07910043 | 0.499822 | 0.00286701 | 216.783 | 07910042 | -0.000971892 | 0.503661 | 217.177 |
| 2 | 07910044 | 0.501589 | 0.00110000 | 215.972 | 07910041 | 0.000680740 | 0.502008 | 212.930 |
| 3 | 07910039 | 0.499554 | 0.00313500 | 215.414 | 07910038 | 0.00000 | 0.502689 | 210.092 |