| Red | Green | Blue | |
| z | 17.63 | ||
| znorm | Inf | ||
| sky | -Inf | -NaN | -Inf |
| S/N | 32.3 | 54.2 | 57.3 |
| S/N(c) | 0.0 | 0.0 | 0.0 |
| SN(E/C) |

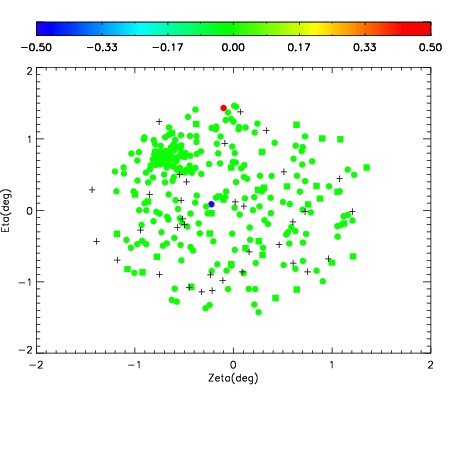
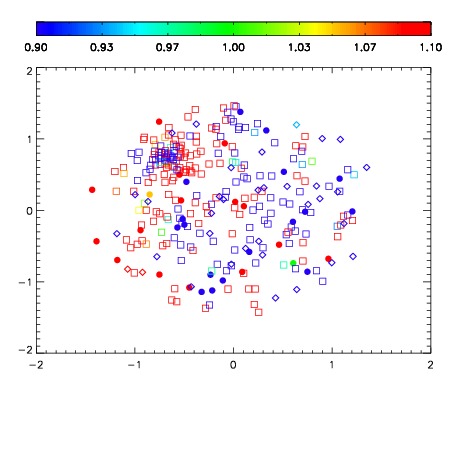


| Frame | Nreads | Zeropoints | Mag plots | Spatial mag deviation | Spatial sky 16325A emission deviations (filled: sky, open: star) | Spatial sky continuum emission | Spatial sky telluric CO2 absorption deviations (filled: H < 10) | |||||||||||||||||||||||
| 0 | 0 |
|
|
|
|
|
|
| IPAIR | NAME | SHIFT | NEWSHIFT | S/N | NAME | SHIFT | NEWSHIFT | S/N |
| 0 | 07920071 | 0.493135 | 0.00000 | 229.619 | 07920078 | -0.00463208 | 0.497767 | 226.225 |
| 1 | 07920072 | 0.493020 | 0.000115007 | 241.220 | 07920073 | -0.000875122 | 0.494010 | 243.899 |
| 2 | 07920080 | 0.490556 | 0.00257900 | 240.595 | 07920077 | -0.00379730 | 0.496932 | 241.257 |
| 3 | 07920079 | 0.489064 | 0.00407100 | 240.416 | 07920081 | -0.00388973 | 0.497025 | 233.539 |
| 4 | 07920075 | 0.488766 | 0.00436899 | 235.013 | 07920074 | -0.00368066 | 0.496816 | 231.689 |
| 5 | 07920076 | 0.489784 | 0.00335100 | 232.911 | 07920070 | 0.00000 | 0.493135 | 227.291 |