| Red | Green | Blue | |
| z | 17.64 | ||
| znorm | Inf | ||
| sky | -Inf | -Inf | -Inf |
| S/N | 14.9 | 28.0 | 28.0 |
| S/N(c) | 0.0 | 0.0 | 0.0 |
| SN(E/C) |
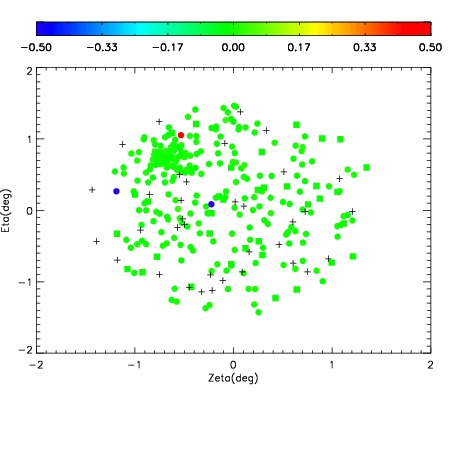
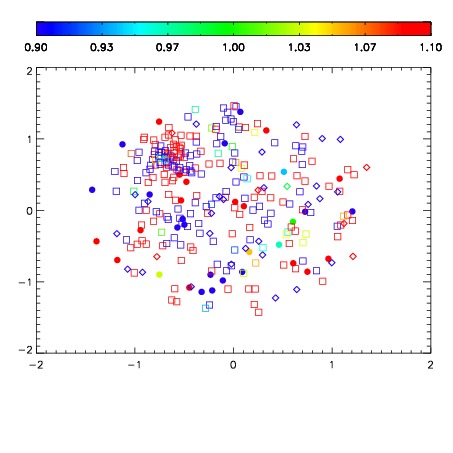
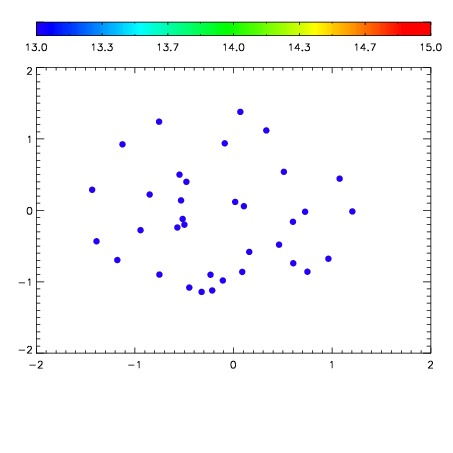

| Frame | Nreads | Zeropoints | Mag plots | Spatial mag deviation | Spatial sky 16325A emission deviations (filled: sky, open: star) | Spatial sky continuum emission | Spatial sky telluric CO2 absorption deviations (filled: H < 10) | |||||||||||||||||||||||
| 0 | 0 |
|
|
|
|
|
|
| IPAIR | NAME | SHIFT | NEWSHIFT | S/N | NAME | SHIFT | NEWSHIFT | S/N |
| 0 | 08130044 | 0.514447 | 0.00000 | 135.891 | 08130038 | 0.00000 | 0.514447 | 145.095 |
| 1 | 08130040 | 0.512442 | 0.00200498 | 149.960 | 08130045 | 0.00125255 | 0.513194 | 152.556 |
| 2 | 08130043 | 0.509938 | 0.00450897 | 139.407 | 08130041 | 0.000188745 | 0.514258 | 146.656 |
| 3 | 08130039 | 0.510851 | 0.00359595 | 134.117 | 08130042 | -0.00161222 | 0.516059 | 132.740 |