| Red | Green | Blue | |
| z | 17.64 | ||
| znorm | Inf | ||
| sky | -Inf | -Inf | -Inf |
| S/N | 18.5 | 31.8 | 33.1 |
| S/N(c) | 0.0 | 0.0 | 0.0 |
| SN(E/C) |
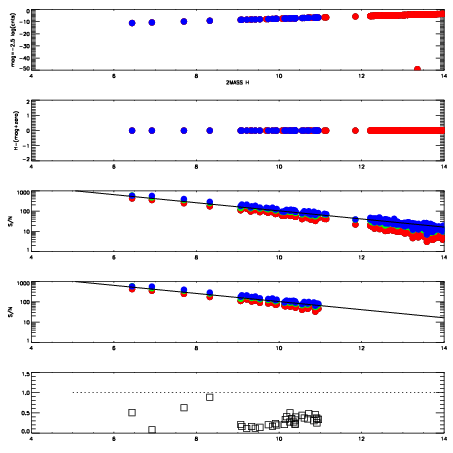
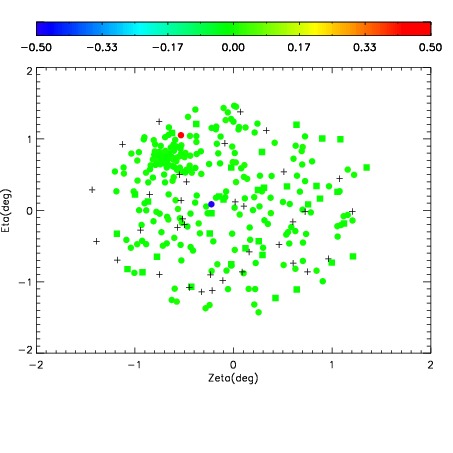
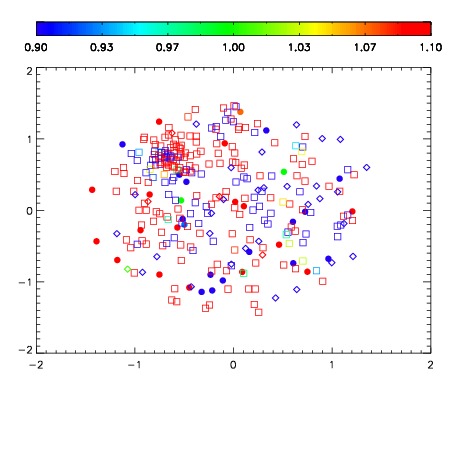
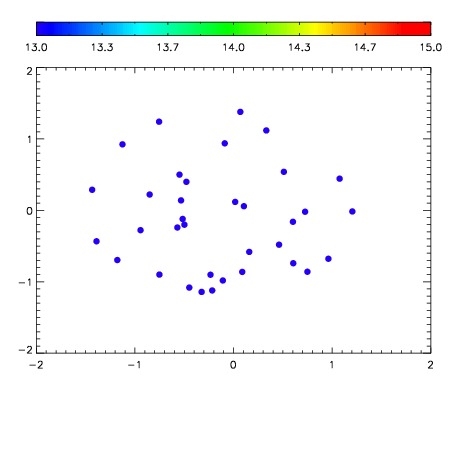

| Frame | Nreads | Zeropoints | Mag plots | Spatial mag deviation | Spatial sky 16325A emission deviations (filled: sky, open: star) | Spatial sky continuum emission | Spatial sky telluric CO2 absorption deviations (filled: H < 10) | |||||||||||||||||||||||
| 0 | 0 |
|
|
|
|
|
|
| IPAIR | NAME | SHIFT | NEWSHIFT | S/N | NAME | SHIFT | NEWSHIFT | S/N |
| 0 | 08190053 | 0.509655 | 0.00000 | 192.044 | 08190054 | -0.000589740 | 0.510245 | 190.545 |
| 1 | 08190049 | 0.508196 | 0.00145900 | 216.959 | 08190047 | 0.00000 | 0.509655 | 220.360 |
| 2 | 08190052 | 0.504247 | 0.00540799 | 194.339 | 08190050 | 0.000892918 | 0.508762 | 198.176 |