| Red | Green | Blue | |
| z | 17.64 | ||
| znorm | Inf | ||
| sky | -Inf | -Inf | -Inf |
| S/N | 20.8 | 39.4 | 41.9 |
| S/N(c) | 0.0 | 0.0 | 0.0 |
| SN(E/C) |


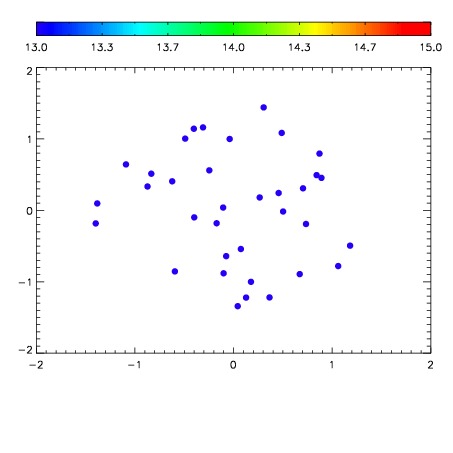

| Frame | Nreads | Zeropoints | Mag plots | Spatial mag deviation | Spatial sky 16325A emission deviations (filled: sky, open: star) | Spatial sky continuum emission | Spatial sky telluric CO2 absorption deviations (filled: H < 10) | |||||||||||||||||||||||
| 0 | 0 |
|
|
|
|
|
|
| IPAIR | NAME | SHIFT | NEWSHIFT | S/N | NAME | SHIFT | NEWSHIFT | S/N |
| 0 | 07610054 | 0.479393 | 0.00000 | 165.493 | 07610055 | -0.000819344 | 0.480212 | 173.801 |
| 1 | 07610049 | 0.476726 | 0.00266701 | 192.274 | 07610051 | 0.00187623 | 0.477517 | 191.722 |
| 2 | 07610050 | 0.477742 | 0.00165102 | 189.266 | 07610048 | 0.00000 | 0.479393 | 185.120 |
| 3 | 07610053 | 0.477820 | 0.00157300 | 179.446 | 07610052 | 0.000356000 | 0.479037 | 181.443 |