| Red | Green | Blue | |
| z | 17.64 | ||
| znorm | Inf | ||
| sky | -Inf | -Inf | -Inf |
| S/N | 22.2 | 40.4 | 46.1 |
| S/N(c) | 0.0 | 0.0 | 0.0 |
| SN(E/C) |
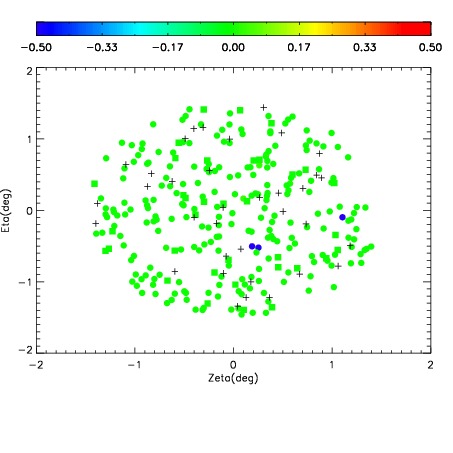
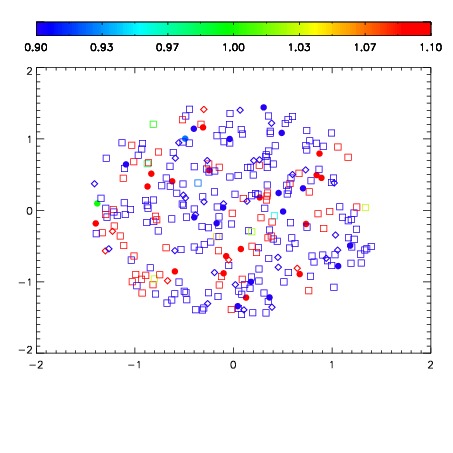
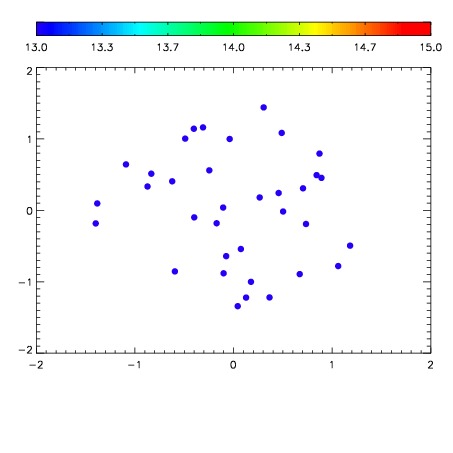

| Frame | Nreads | Zeropoints | Mag plots | Spatial mag deviation | Spatial sky 16325A emission deviations (filled: sky, open: star) | Spatial sky continuum emission | Spatial sky telluric CO2 absorption deviations (filled: H < 10) | |||||||||||||||||||||||
| 0 | 0 |
|
|
|
|
|
|
| IPAIR | NAME | SHIFT | NEWSHIFT | S/N | NAME | SHIFT | NEWSHIFT | S/N |
| 0 | 07850039 | 0.470567 | 0.00000 | 179.969 | 07850040 | -0.000407621 | 0.470975 | 177.852 |
| 1 | 07850043 | 0.469089 | 0.00147799 | 174.493 | 07850041 | -0.000247909 | 0.470815 | 176.032 |
| 2 | 07850038 | 0.469183 | 0.00138399 | 173.997 | 07850044 | 0.000965640 | 0.469601 | 174.000 |
| 3 | 07850042 | 0.468579 | 0.00198799 | 171.643 | 07850037 | 0.00000 | 0.470567 | 169.998 |