| Red | Green | Blue | |
| z | 17.64 | ||
| znorm | Inf | ||
| sky | -Inf | -Inf | -Inf |
| S/N | 23.3 | 39.2 | 44.2 |
| S/N(c) | 0.0 | 0.0 | 0.0 |
| SN(E/C) |
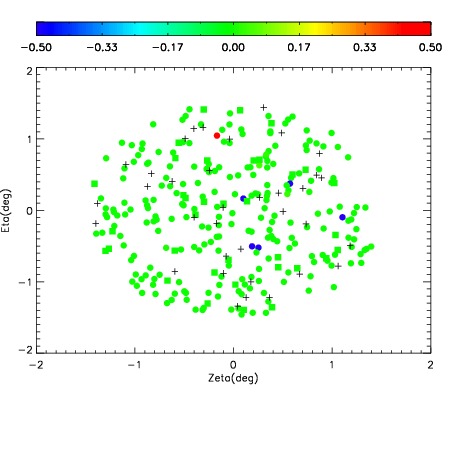
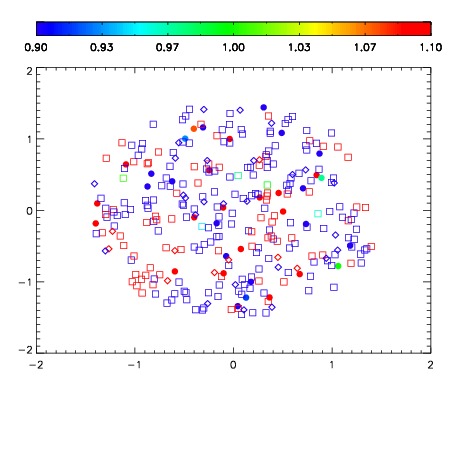
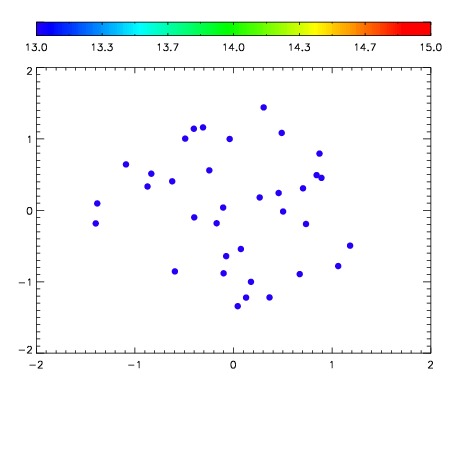

| Frame | Nreads | Zeropoints | Mag plots | Spatial mag deviation | Spatial sky 16325A emission deviations (filled: sky, open: star) | Spatial sky continuum emission | Spatial sky telluric CO2 absorption deviations (filled: H < 10) | |||||||||||||||||||||||
| 0 | 0 |
|
|
|
|
|
|
| IPAIR | NAME | SHIFT | NEWSHIFT | S/N | NAME | SHIFT | NEWSHIFT | S/N |
| 0 | 08170017 | 0.514647 | 0.00000 | 193.678 | 08170014 | -0.00348834 | 0.518135 | 165.932 |
| 1 | 08170016 | 0.503989 | 0.0106580 | 214.351 | 08170011 | 0.00000 | 0.514647 | 208.824 |
| 2 | 08170012 | 0.505402 | 0.00924498 | 209.077 | 08170015 | -0.00428941 | 0.518936 | 191.890 |
| 3 | 08170013 | 0.510507 | 0.00414002 | 193.011 | 08170018 | -0.00100185 | 0.515649 | 107.915 |