| Red | Green | Blue | |
| z | 17.64 | ||
| znorm | Inf | ||
| sky | -Inf | -Inf | -NaN |
| S/N | 22.8 | 40.4 | 45.8 |
| S/N(c) | 0.0 | 0.0 | 0.0 |
| SN(E/C) |
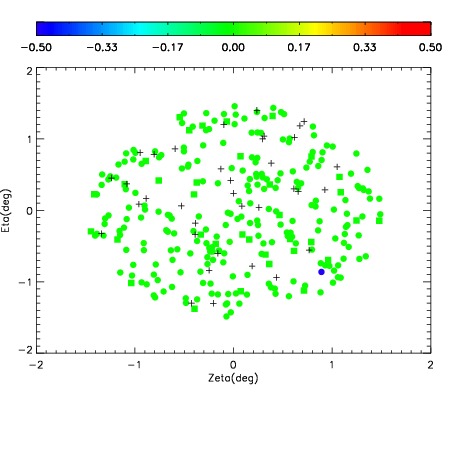
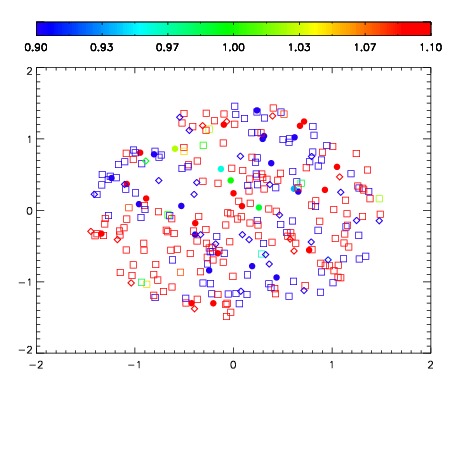
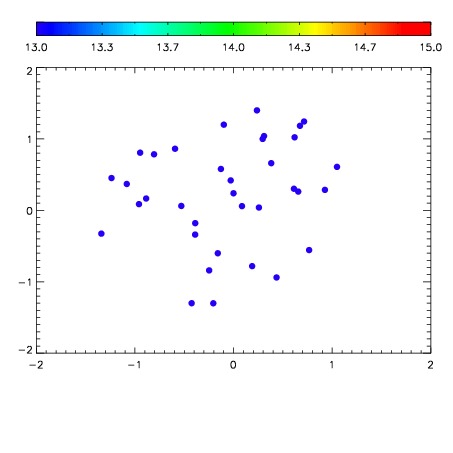

| Frame | Nreads | Zeropoints | Mag plots | Spatial mag deviation | Spatial sky 16325A emission deviations (filled: sky, open: star) | Spatial sky continuum emission | Spatial sky telluric CO2 absorption deviations (filled: H < 10) | |||||||||||||||||||||||
| 0 | 0 |
|
|
|
|
|
|
| IPAIR | NAME | SHIFT | NEWSHIFT | S/N | NAME | SHIFT | NEWSHIFT | S/N |
| 0 | 07530077 | 0.481458 | 0.00000 | 230.134 | 07530079 | 0.00634903 | 0.475109 | 231.817 |
| 1 | 07530078 | 0.481448 | 1.00136e-05 | 228.278 | 07530075 | 0.00538184 | 0.476076 | 221.559 |
| 2 | 07530073 | 0.478630 | 0.00282800 | 213.832 | 07530076 | 0.00426630 | 0.477192 | 214.860 |
| 3 | 07530074 | 0.480010 | 0.00144801 | 204.079 | 07530072 | 0.00000 | 0.481458 | 203.253 |