| Red | Green | Blue | |
| z | 17.64 | ||
| znorm | Inf | ||
| sky | -Inf | -Inf | -Inf |
| S/N | 24.7 | 42.4 | 47.8 |
| S/N(c) | 0.0 | 0.0 | 0.0 |
| SN(E/C) |
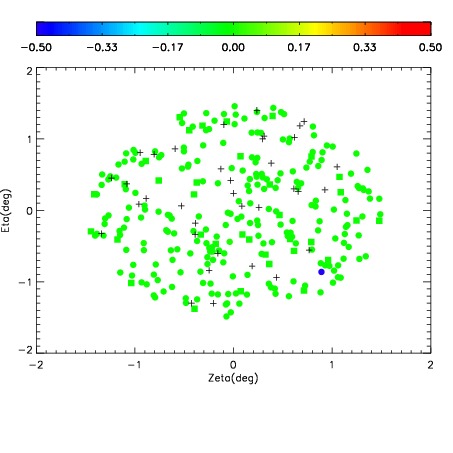
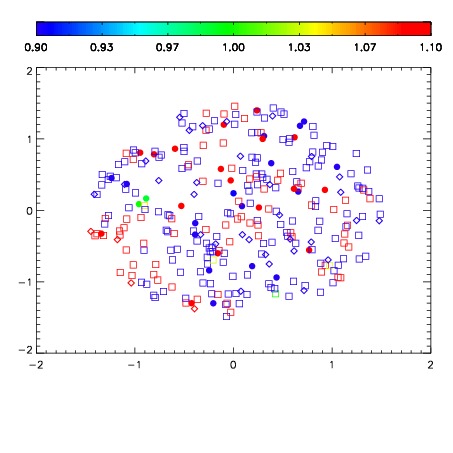
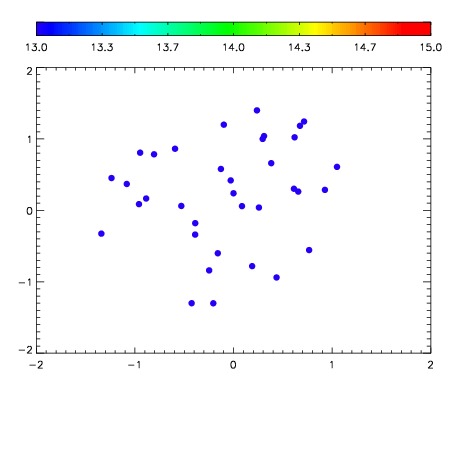

| Frame | Nreads | Zeropoints | Mag plots | Spatial mag deviation | Spatial sky 16325A emission deviations (filled: sky, open: star) | Spatial sky continuum emission | Spatial sky telluric CO2 absorption deviations (filled: H < 10) | |||||||||||||||||||||||
| 0 | 0 |
|
|
|
|
|
|
| IPAIR | NAME | SHIFT | NEWSHIFT | S/N | NAME | SHIFT | NEWSHIFT | S/N |
| 0 | 07620028 | 0.482038 | 0.00000 | 203.531 | 07620029 | -0.00222537 | 0.484263 | 199.624 |
| 1 | 07620031 | 0.479177 | 0.00286099 | 245.488 | 07620026 | 0.00000 | 0.482038 | 224.895 |
| 2 | 07620032 | 0.479765 | 0.00227299 | 235.235 | 07620033 | -0.00305225 | 0.485090 | 224.512 |
| 3 | 07620027 | 0.481808 | 0.000229985 | 205.270 | 07620030 | -0.00332334 | 0.485361 | 221.001 |