| Red | Green | Blue | |
| z | 17.64 | ||
| znorm | Inf | ||
| sky | -NaN | -Inf | -Inf |
| S/N | 24.8 | 43.7 | 48.3 |
| S/N(c) | 0.0 | 0.0 | 0.0 |
| SN(E/C) |
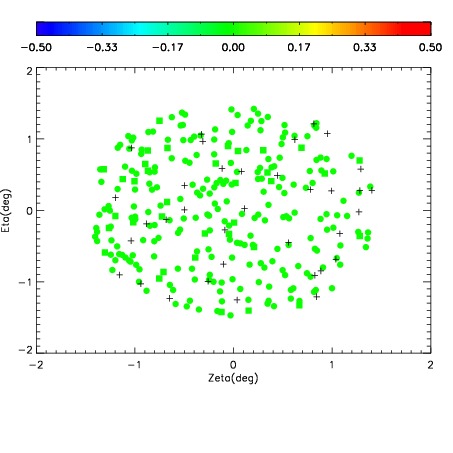
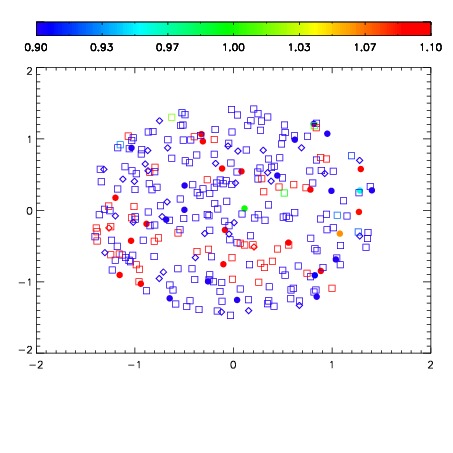
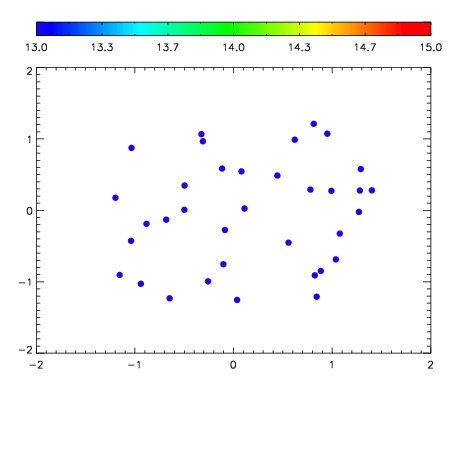

| Frame | Nreads | Zeropoints | Mag plots | Spatial mag deviation | Spatial sky 16325A emission deviations (filled: sky, open: star) | Spatial sky continuum emission | Spatial sky telluric CO2 absorption deviations (filled: H < 10) | |||||||||||||||||||||||
| 0 | 0 |
|
|
|
|
|
|
| IPAIR | NAME | SHIFT | NEWSHIFT | S/N | NAME | SHIFT | NEWSHIFT | S/N |
| 0 | 08140032 | 0.504690 | 0.00000 | 234.562 | 08140033 | -0.00422561 | 0.508916 | 229.636 |
| 1 | 08140031 | 0.502315 | 0.00237501 | 229.579 | 08140029 | -0.00278724 | 0.507477 | 225.409 |
| 2 | 08140027 | 0.503721 | 0.000968993 | 229.433 | 08140030 | -0.00417916 | 0.508869 | 220.010 |
| 3 | 08140028 | 0.504563 | 0.000127017 | 225.877 | 08140026 | 0.00000 | 0.504690 | 207.058 |