| Red | Green | Blue | |
| z | 17.64 | ||
| znorm | Inf | ||
| sky | -NaN | -Inf | -Inf |
| S/N | 30.1 | 51.2 | 56.6 |
| S/N(c) | 0.0 | 0.0 | 0.0 |
| SN(E/C) |
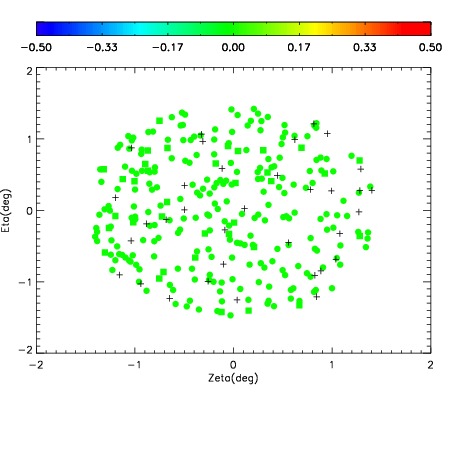
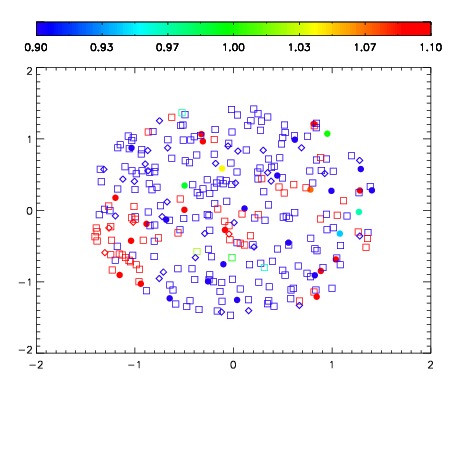
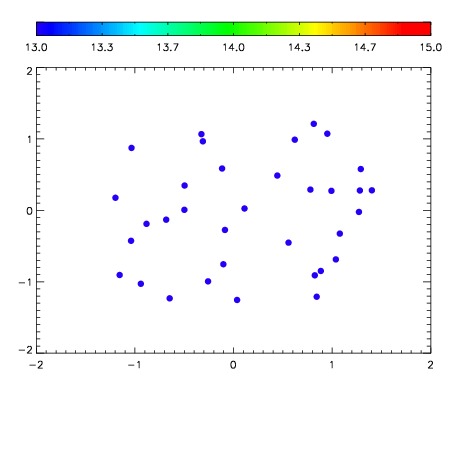

| Frame | Nreads | Zeropoints | Mag plots | Spatial mag deviation | Spatial sky 16325A emission deviations (filled: sky, open: star) | Spatial sky continuum emission | Spatial sky telluric CO2 absorption deviations (filled: H < 10) | |||||||||||||||||||||||
| 0 | 0 |
|
|
|
|
|
|
| IPAIR | NAME | SHIFT | NEWSHIFT | S/N | NAME | SHIFT | NEWSHIFT | S/N |
| 0 | 08190016 | 0.503926 | 0.00000 | 226.004 | 08190010 | 0.00000 | 0.503926 | 222.684 |
| 1 | 08190012 | 0.501984 | 0.00194198 | 227.763 | 08190013 | -0.00258282 | 0.506509 | 229.283 |
| 2 | 08190011 | 0.494784 | 0.00914198 | 227.649 | 08190014 | -0.00578884 | 0.509715 | 228.639 |
| 3 | 08190015 | 0.499000 | 0.00492597 | 226.918 | 08190017 | -0.00213311 | 0.506059 | 224.440 |