| Red | Green | Blue | |
| z | 17.64 | ||
| znorm | Inf | ||
| sky | -Inf | -Inf | -Inf |
| S/N | 32.7 | 52.5 | 62.7 |
| S/N(c) | 0.0 | 0.0 | 0.0 |
| SN(E/C) |
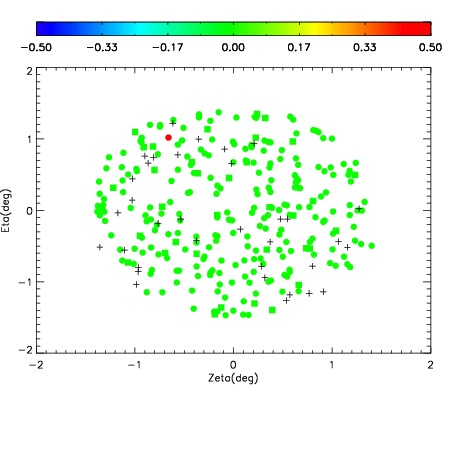
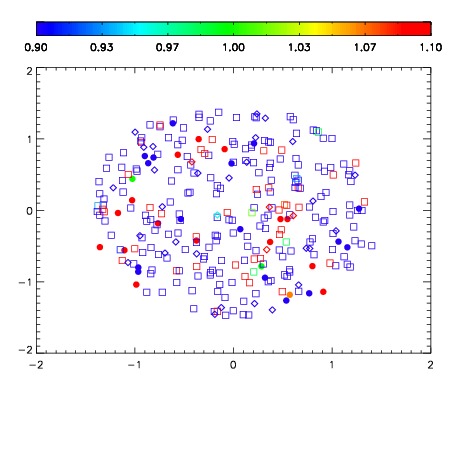
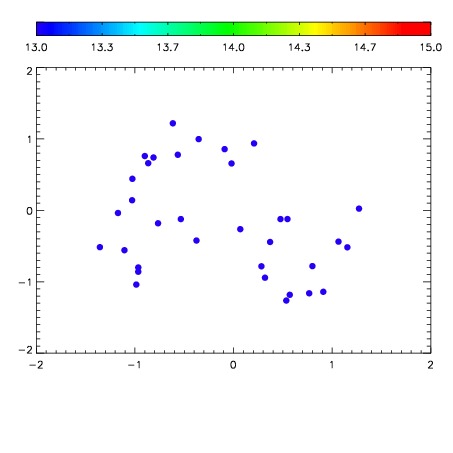

| Frame | Nreads | Zeropoints | Mag plots | Spatial mag deviation | Spatial sky 16325A emission deviations (filled: sky, open: star) | Spatial sky continuum emission | Spatial sky telluric CO2 absorption deviations (filled: H < 10) | |||||||||||||||||||||||
| 0 | 0 |
|
|
|
|
|
|
| IPAIR | NAME | SHIFT | NEWSHIFT | S/N | NAME | SHIFT | NEWSHIFT | S/N |
| 0 | 07500085 | 0.472150 | 0.00000 | 228.595 | 07500086 | 0.00198709 | 0.470163 | 229.464 |
| 1 | 07500080 | 0.469198 | 0.00295201 | 229.344 | 07500087 | 0.00148159 | 0.470668 | 232.278 |
| 2 | 07500081 | 0.470459 | 0.00169098 | 228.805 | 07500079 | 0.00000 | 0.472150 | 230.951 |
| 3 | 07500088 | 0.471647 | 0.000503004 | 228.365 | 07500082 | 0.000774760 | 0.471375 | 227.629 |
| 4 | 07500084 | 0.471356 | 0.000793993 | 227.012 | 07500083 | 0.00211673 | 0.470033 | 226.460 |