| Red | Green | Blue | |
| z | 17.64 | ||
| znorm | Inf | ||
| sky | -Inf | -Inf | -Inf |
| S/N | 30.0 | 50.2 | 58.1 |
| S/N(c) | 0.0 | 0.0 | 0.0 |
| SN(E/C) |
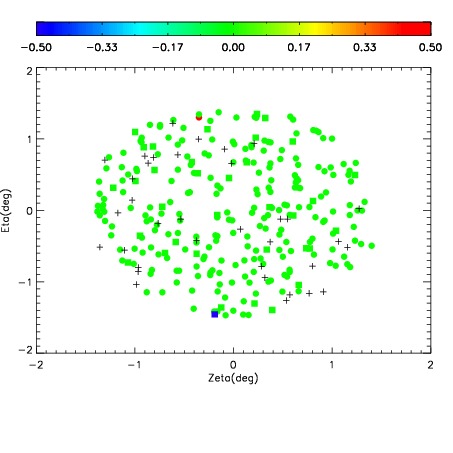
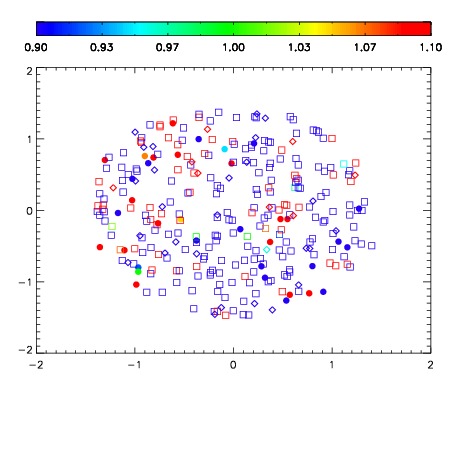
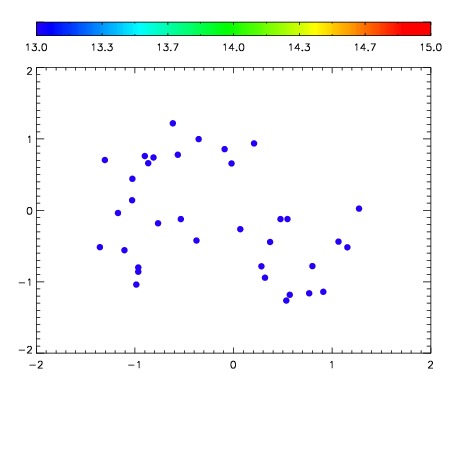

| Frame | Nreads | Zeropoints | Mag plots | Spatial mag deviation | Spatial sky 16325A emission deviations (filled: sky, open: star) | Spatial sky continuum emission | Spatial sky telluric CO2 absorption deviations (filled: H < 10) | |||||||||||||||||||||||
| 0 | 0 |
|
|
|
|
|
|
| IPAIR | NAME | SHIFT | NEWSHIFT | S/N | NAME | SHIFT | NEWSHIFT | S/N |
| 0 | 07540076 | 0.475237 | 0.00000 | 252.307 | 07540081 | 0.000566275 | 0.474671 | 250.559 |
| 1 | 07540075 | 0.474282 | 0.000955015 | 250.571 | 07540074 | 0.00000 | 0.475237 | 250.185 |
| 2 | 07540080 | 0.474980 | 0.000257015 | 249.955 | 07540078 | -0.00135601 | 0.476593 | 249.460 |
| 3 | 07540079 | 0.474401 | 0.000836015 | 249.706 | 07540077 | 0.00140815 | 0.473829 | 249.399 |