| Red | Green | Blue | |
| z | 17.64 | ||
| znorm | Inf | ||
| sky | -Inf | -NaN | -Inf |
| S/N | 24.5 | 42.3 | 48.0 |
| S/N(c) | 0.0 | 0.0 | 0.0 |
| SN(E/C) |


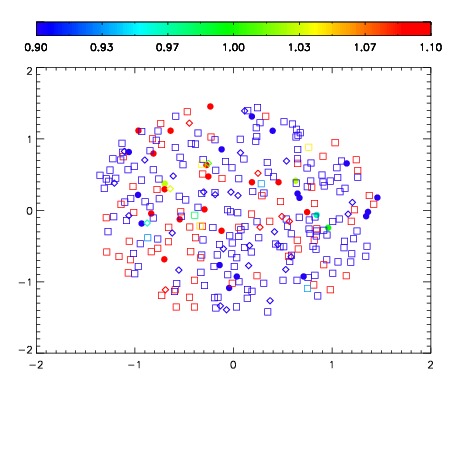
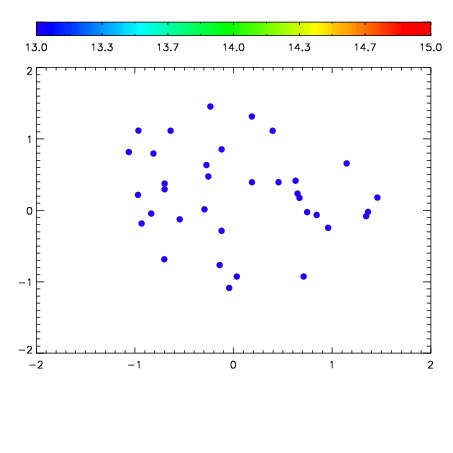

| Frame | Nreads | Zeropoints | Mag plots | Spatial mag deviation | Spatial sky 16325A emission deviations (filled: sky, open: star) | Spatial sky continuum emission | Spatial sky telluric CO2 absorption deviations (filled: H < 10) | |||||||||||||||||||||||
| 0 | 0 |
|
|
|
|
|
|
| IPAIR | NAME | SHIFT | NEWSHIFT | S/N | NAME | SHIFT | NEWSHIFT | S/N |
| 0 | 07220073 | 0.478430 | 0.00000 | 205.943 | 07220076 | 0.00254293 | 0.475887 | 192.203 |
| 1 | 07220078 | 0.476878 | 0.00155202 | 219.484 | 07220075 | 0.00266463 | 0.475765 | 221.527 |
| 2 | 07220077 | 0.476448 | 0.00198200 | 218.248 | 07220079 | 0.00284096 | 0.475589 | 216.054 |
| 3 | 07220081 | 0.474409 | 0.00402099 | 213.194 | 07220080 | 0.00163361 | 0.476796 | 210.725 |
| 4 | 07220074 | 0.478401 | 2.89977e-05 | 197.047 | 07220072 | 0.00000 | 0.478430 | 155.760 |