| Red | Green | Blue | |
| z | 17.64 | ||
| znorm | Inf | ||
| sky | -NaN | -NaN | -Inf |
| S/N | 25.5 | 44.5 | 51.7 |
| S/N(c) | 0.0 | 0.0 | 0.0 |
| SN(E/C) |
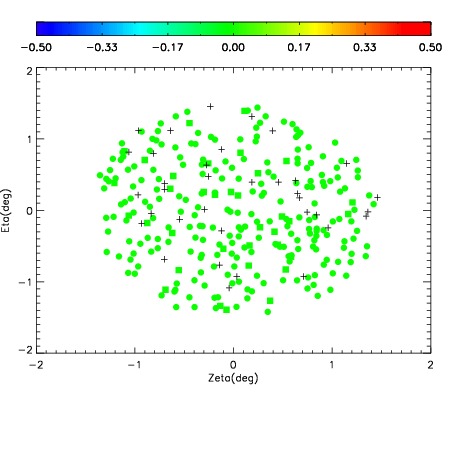
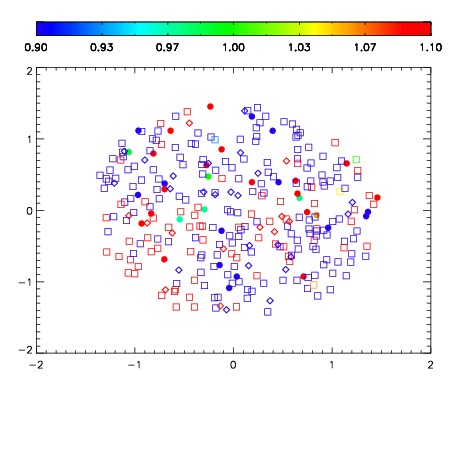
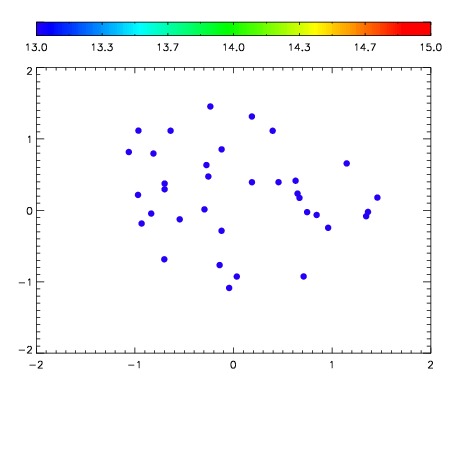

| Frame | Nreads | Zeropoints | Mag plots | Spatial mag deviation | Spatial sky 16325A emission deviations (filled: sky, open: star) | Spatial sky continuum emission | Spatial sky telluric CO2 absorption deviations (filled: H < 10) | |||||||||||||||||||||||
| 0 | 0 |
|
|
|
|
|
|
| IPAIR | NAME | SHIFT | NEWSHIFT | S/N | NAME | SHIFT | NEWSHIFT | S/N |
| 0 | 07280103 | 0.485322 | 0.00000 | 199.534 | 07280094 | 0.00000 | 0.485322 | 203.540 |
| 1 | 07280095 | 0.481575 | 0.00374699 | 209.453 | 07280098 | 0.00180313 | 0.483519 | 209.799 |
| 2 | 07280096 | 0.482230 | 0.00309199 | 206.419 | 07280101 | 0.00271944 | 0.482603 | 206.922 |
| 3 | 07280100 | 0.483568 | 0.00175399 | 203.547 | 07280097 | 0.00380325 | 0.481519 | 204.571 |
| 4 | 07280099 | 0.482350 | 0.00297201 | 198.140 | 07280102 | 0.00213833 | 0.483184 | 200.109 |