| Red | Green | Blue | |
| z | 17.64 | ||
| znorm | Inf | ||
| sky | -NaN | -NaN | -Inf |
| S/N | 23.7 | 40.7 | 46.7 |
| S/N(c) | 0.0 | 0.0 | 0.0 |
| SN(E/C) |
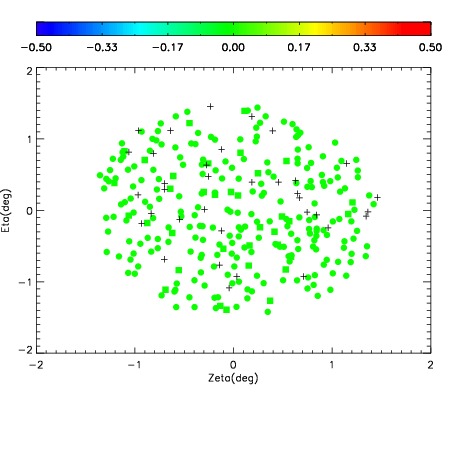

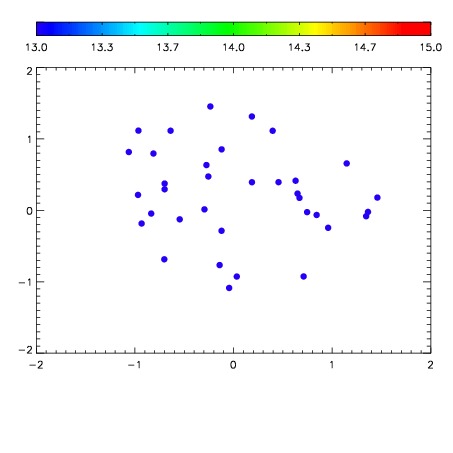

| Frame | Nreads | Zeropoints | Mag plots | Spatial mag deviation | Spatial sky 16325A emission deviations (filled: sky, open: star) | Spatial sky continuum emission | Spatial sky telluric CO2 absorption deviations (filled: H < 10) | |||||||||||||||||||||||
| 0 | 0 |
|
|
|
|
|
|
| IPAIR | NAME | SHIFT | NEWSHIFT | S/N | NAME | SHIFT | NEWSHIFT | S/N |
| 0 | 07530067 | 0.478721 | 0.00000 | 188.411 | 07530061 | 0.00000 | 0.478721 | 190.122 |
| 1 | 07530062 | 0.475668 | 0.00305298 | 195.085 | 07530068 | 0.00348904 | 0.475232 | 195.119 |
| 2 | 07530066 | 0.478271 | 0.000449985 | 184.378 | 07530064 | 0.00470710 | 0.474014 | 183.716 |
| 3 | 07530063 | 0.477885 | 0.000835985 | 183.924 | 07530065 | 0.00331831 | 0.475403 | 180.537 |