| Red | Green | Blue | |
| z | 17.64 | ||
| znorm | Inf | ||
| sky | -Inf | -Inf | -Inf |
| S/N | 21.5 | 42.4 | 44.7 |
| S/N(c) | 0.0 | 0.0 | 0.0 |
| SN(E/C) |
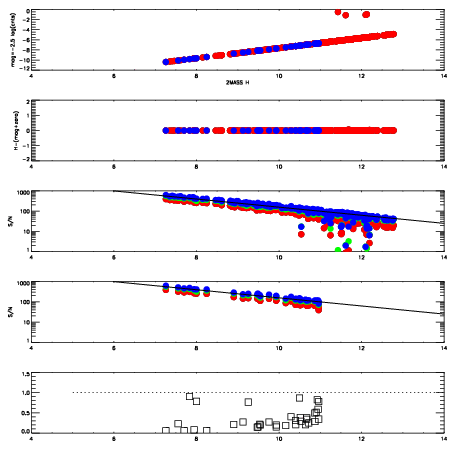
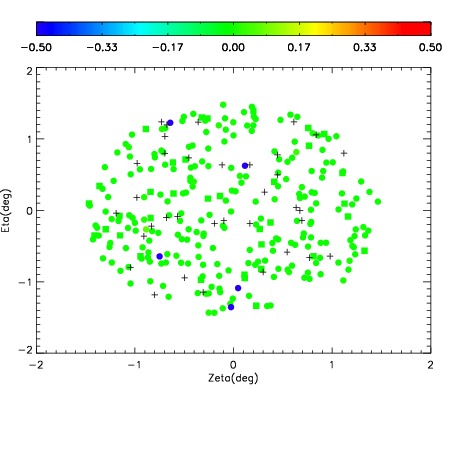
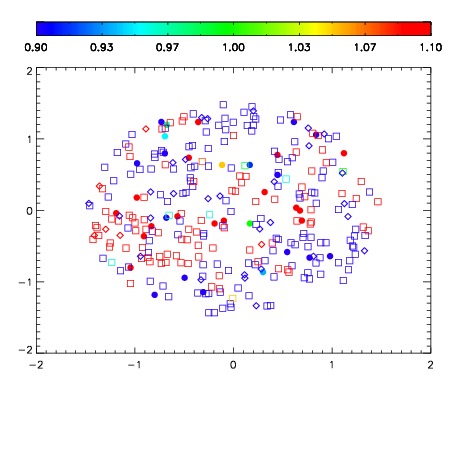
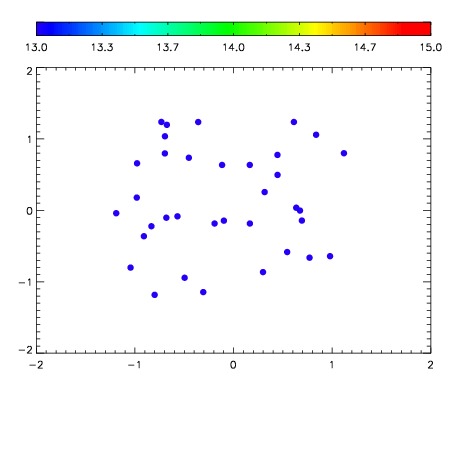

| Frame | Nreads | Zeropoints | Mag plots | Spatial mag deviation | Spatial sky 16325A emission deviations (filled: sky, open: star) | Spatial sky continuum emission | Spatial sky telluric CO2 absorption deviations (filled: H < 10) | |||||||||||||||||||||||
| 0 | 0 |
|
|
|
|
|
|
| IPAIR | NAME | SHIFT | NEWSHIFT | S/N | NAME | SHIFT | NEWSHIFT | S/N |
| 0 | 07260110 | 0.480779 | 0.00000 | 118.672 | 07260109 | -0.00271811 | 0.483497 | 128.332 |
| 1 | 07260102 | 0.469037 | 0.0117420 | 192.828 | 07260104 | -0.00313899 | 0.483918 | 185.719 |
| 2 | 07260103 | 0.468932 | 0.0118470 | 187.837 | 07260100 | -0.00308292 | 0.483862 | 185.658 |
| 3 | 07260106 | 0.471279 | 0.00950000 | 186.052 | 07260105 | -0.00516966 | 0.485949 | 185.128 |
| 4 | 07260107 | 0.473156 | 0.00762299 | 181.775 | 07260101 | -0.00414243 | 0.484921 | 182.953 |
| 5 | 07260099 | 0.467655 | 0.0131240 | 178.770 | 07260097 | 0.00000 | 0.480779 | 164.484 |
| 6 | 07260098 | 0.468176 | 0.0126030 | 167.955 | 07260108 | -0.000714409 | 0.481493 | 154.756 |