| Red | Green | Blue | |
| z | 17.64 | ||
| znorm | Inf | ||
| sky | -Inf | -Inf | -Inf |
| S/N | 20.0 | 37.9 | 40.5 |
| S/N(c) | 0.0 | 0.0 | 0.0 |
| SN(E/C) |
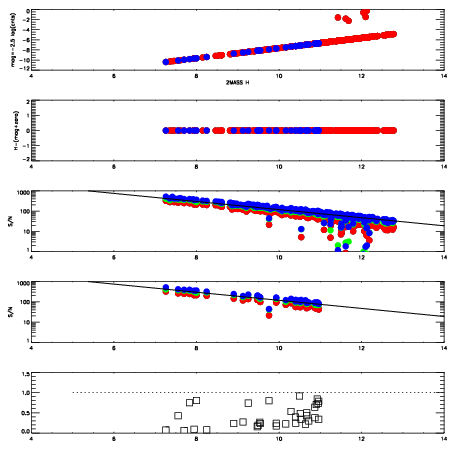
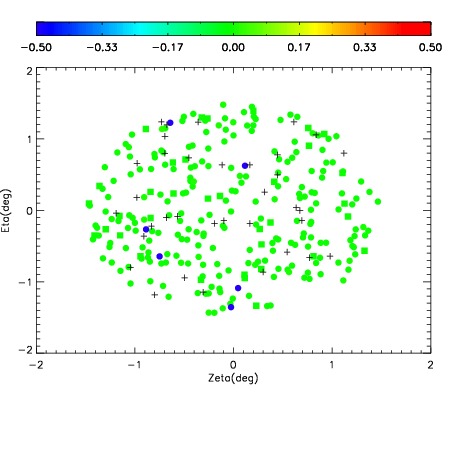
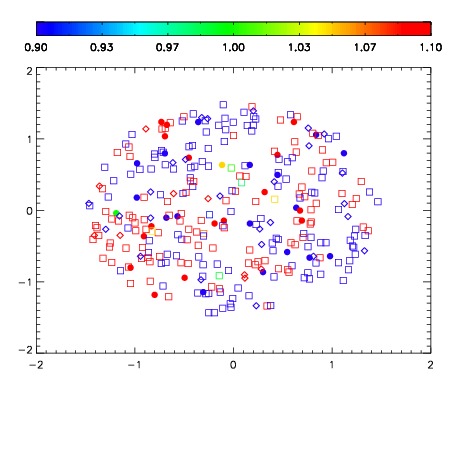
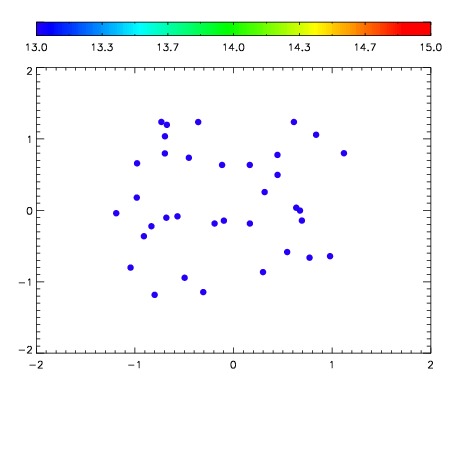

| Frame | Nreads | Zeropoints | Mag plots | Spatial mag deviation | Spatial sky 16325A emission deviations (filled: sky, open: star) | Spatial sky continuum emission | Spatial sky telluric CO2 absorption deviations (filled: H < 10) | |||||||||||||||||||||||
| 0 | 0 |
|
|
|
|
|
|
| IPAIR | NAME | SHIFT | NEWSHIFT | S/N | NAME | SHIFT | NEWSHIFT | S/N |
| 0 | 07510079 | 0.474836 | 0.00000 | 185.028 | 07510080 | 0.00464064 | 0.470195 | 200.440 |
| 1 | 07510078 | 0.473632 | 0.00120398 | 184.551 | 07510077 | 0.00122650 | 0.473609 | 187.574 |
| 2 | 07510074 | 0.472007 | 0.00282899 | 181.503 | 07510073 | 0.00000 | 0.474836 | 185.076 |
| 3 | 07510075 | 0.473289 | 0.00154698 | 178.194 | 07510076 | 0.00230183 | 0.472534 | 178.502 |